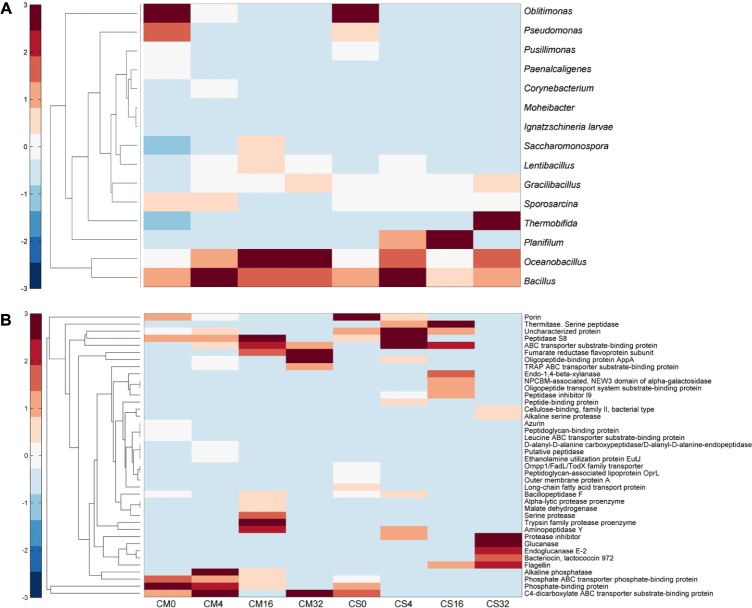
FIGURE 5.
Heatmap of identified proteins of the samples along with composting time. (A) Relative abundances of identified proteins belonging to dominant genera. (B) Relative abundances of identified extracellular proteins. CM, middle layer (∼20 cm depth) of chicken manure compost. CS, middle layer (∼20 cm depth) of chicken manure compost with added maize straw. Samples from days 0, 4, 16, and 32 were chosen for performing metaproteomics analysis. The software Matlab (version R2014a) was used to conduct this analysis.

