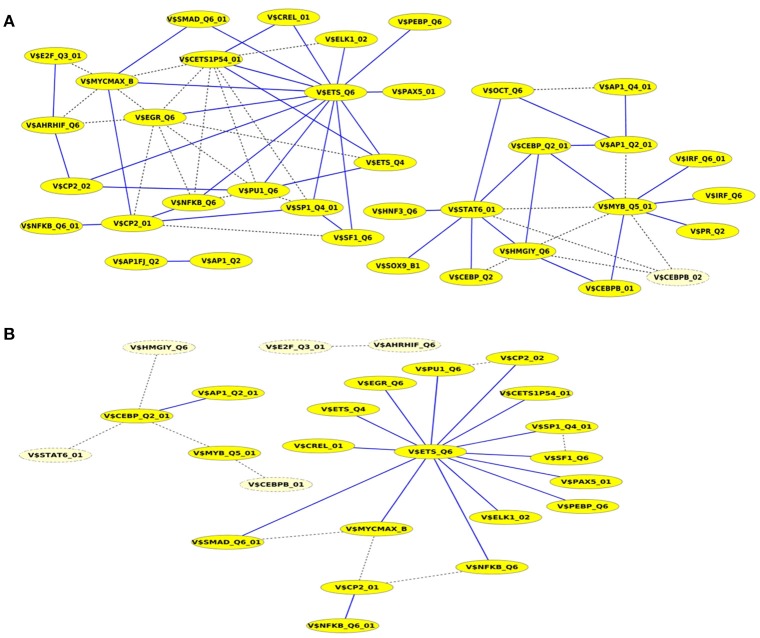
Figure 5.
Cooperation network according to PC-TraFF significant TFBS pairs for Basal-like gene set. The nodes represent TFBSs identified by the indicated PWMs. Edges represent their potential cooperation based on observed co-occurrences. After applying our extension approach: while blue edges correspond to the sequence-set specific cooperations for (A) α = 0.2 and (B) α = 0.5, the common (generally important) cooperations are shown by dashed lines. The nodes with light yellow color indicate TFBSs that are involved in common TF cooperations, but not in the specific pairs.

