Figure 2.
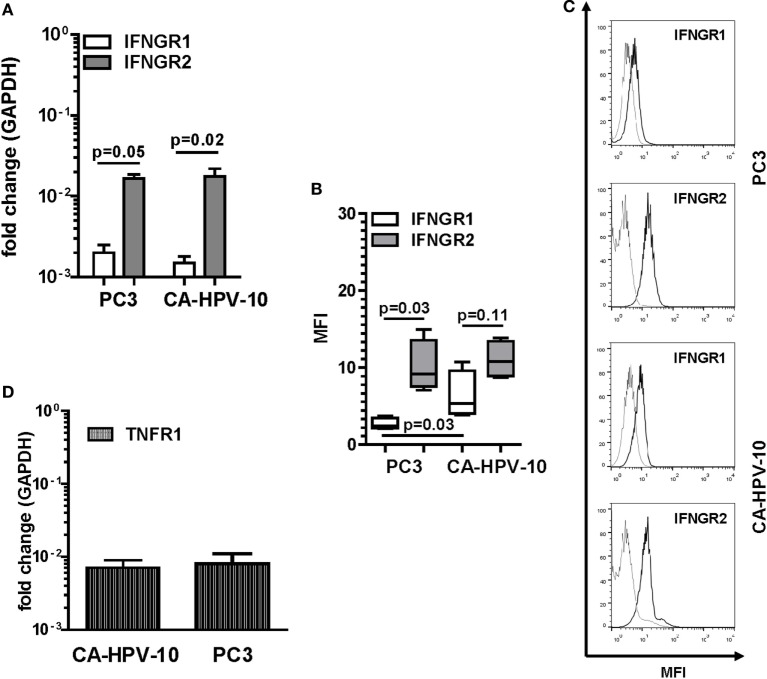
Interferon gamma receptors (IFNGRs) and tumor necrosis factor receptor 1 (TNFR1) gene and protein expression in prostate cancer (PCa) cell lines. (A) Gene expression of IFNGR1 (white bars) and IFNGR2 (gray bars) in PC3 and CA-HPV-10 cell lines. A higher expression of IFNGR2 than of IFNGR1 was observed in both cell lines (Mann–Whitney U test, PC3 p = 0.05 and CA-HPV-10 p = 0.02). (B) Mean fluorescence intensity (MFI) by fluorescent-activated cell sorting of IFNGR1 (white boxes) and IFNGR2 (gray boxes) specific staining in PC3 and CA-HPV-10 cell lines. (C) Representative overlaid histograms refer to MFI of IFNGR1 and IFNGR2, when compared with isotype staining. IFNGR2 was expressed to higher extents than IFNGR1 only in PC3 (Mann–Whitney U test, p = 0.03). IFNGR1 was expressed to a higher level in CA-HPV-10 than in PC3 cells (Mann–Whitney U test, p = 0.03). (D) TNFR1 gene expression in PC3 and CA-HPV-10 cell lines. No significant differences were observed between cell lines (Mann–Whitney U test).

