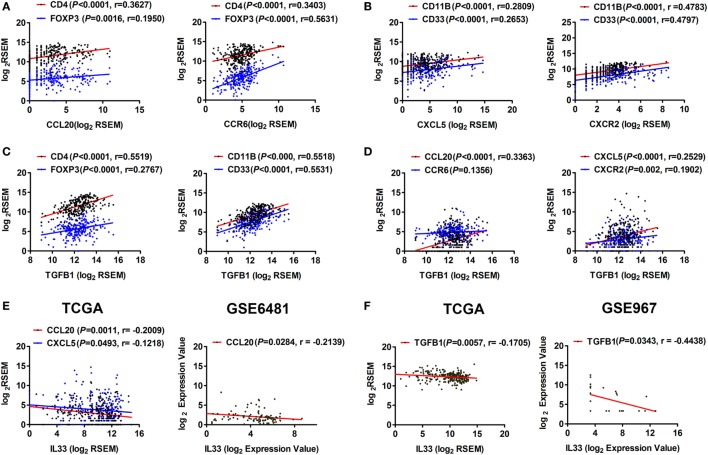
Figure 5.
Correlation between the expression of IL-33 and TGF-β1, chemokines that recruit Tregs and myeloid-derived suppressor cells in soft tissue sarcoma. (A) Positive correlations between the transcriptional levels of CCL20 and its receptor CCR6 and CD4/FOXP3. (B) Positive correlations between the transcriptional levels of CXCL5 and its receptor CXCR2 and CD11B/CD33. (C) Positive correlations between the transcriptional levels of TGFB1 and CD4/FOXP3 and CD11B/CD33. (D) Positive correlations between the transcriptional levels of TGFB1 and CCL20, CXCL5, and CXCR2. Above analyses were performed using data from The Cancer Genome Atlas (TCGA). (E) Negative correlations between the transcriptional levels of IL-33 and the chemokines CCL20 and CXCL5 by analyzing sarcoma data of TCGA and GSE6481. (F) Negative correlation between the transcriptional levels of IL-33 and TGFB1 by analyzing sarcoma data of TCGA and GSE967. The correlation between gene expression levels was analyzed by Pearson correlation test.

