
FIGURE 5.
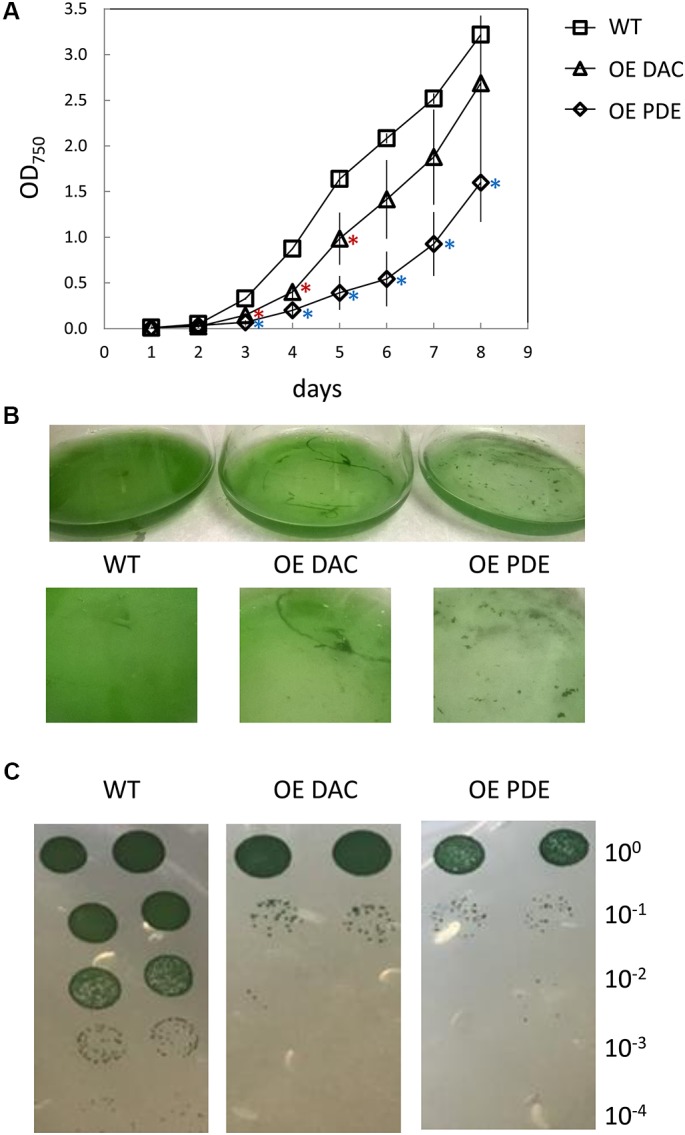
Growth curve of Synechocystis wild-type (WT), strain overexpressing diadenylyl cyclase (OE DAC), and strain overexpressing c-di-AMP phosphodiesterase (OE PDE). (A) All strains were grown in BG-11/HEPES under 35 μmol m-2 s-1 white light. Data points represent averages (± standard deviations). ∗p < 0.05 with red asterisks indicating comparison between OE DAC and WT and blue asterisks comparing OE PDE and WT. (B) Picture of representative WT, OE DAC, and OE PDE cultures. (C) Images of WT, OE DAC, and OE PDE growth as measured by spotting of cells (10 μL) of a 1:10 serial dilution on BG-11/HEPES plates containing 1% (w/v) agar under white light. Cells were initially at an OD750 of 0.6 in the undiluted culture and cells diluted up to 1:10,000-fold.