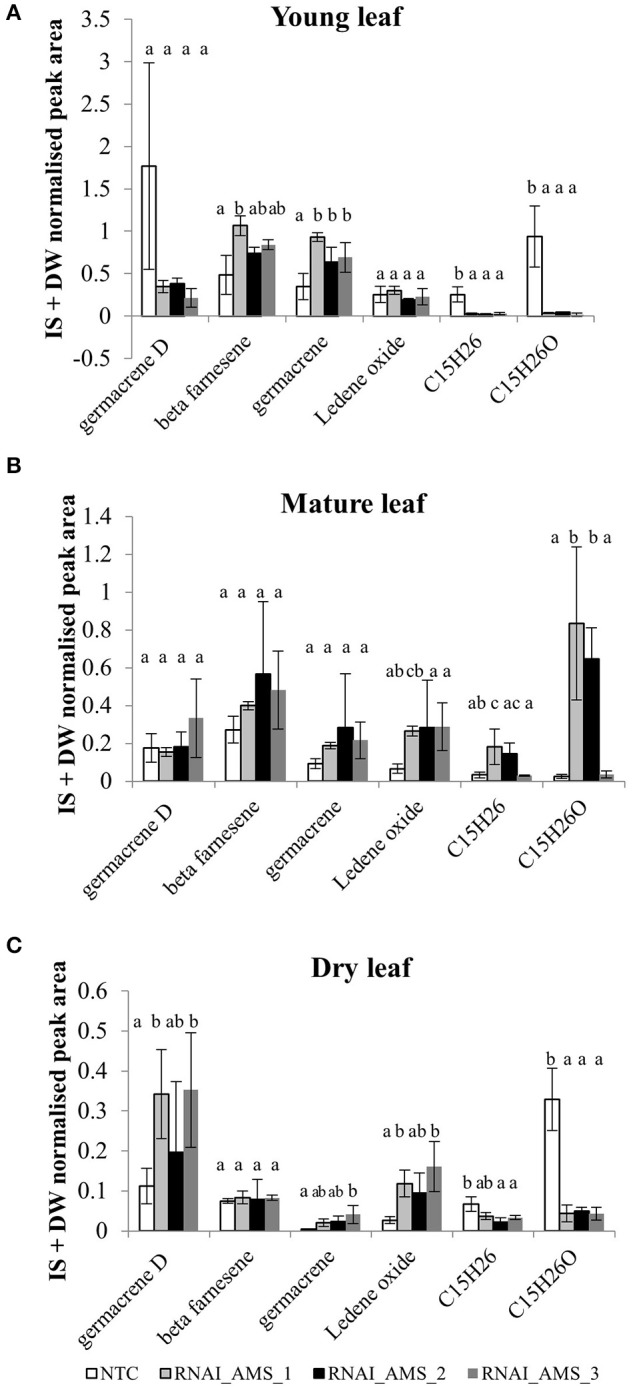
Figure 8.

Internal standard (IS) and dry weight normalized peak area averages for sesquiterpene levels in (A) young leaf, (B) mature leaf, and (C) -pooled dried leaf material in NTC and AMS silenced lines. Error bars ±SD (NTC—n = 6, AMS_RNAi—n = 3). Letters represent Bonferroni test results after ANOVA, groups not sharing letters indicate statistically significant differences (p ≤ 0.05).
