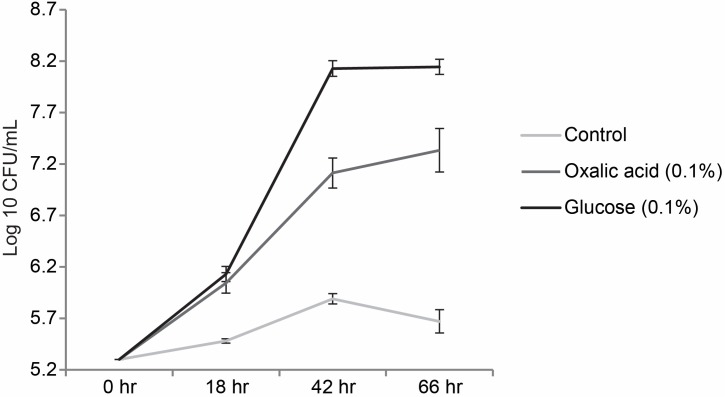
FIGURE 5.
Growth curve of P. terrae BS001 grown on M9 medium supplemented with oxalate; represents the growth patterns of P. terrae BS001 on M9 medium supplemented with 0.1% of glucose, 0.1% oxalate [w/v] and no carbon source. The Y-axis represents CFU/mL on a log 10 scale, while the X-axis shows the times in hours. Data are representative of three biological replicates.

