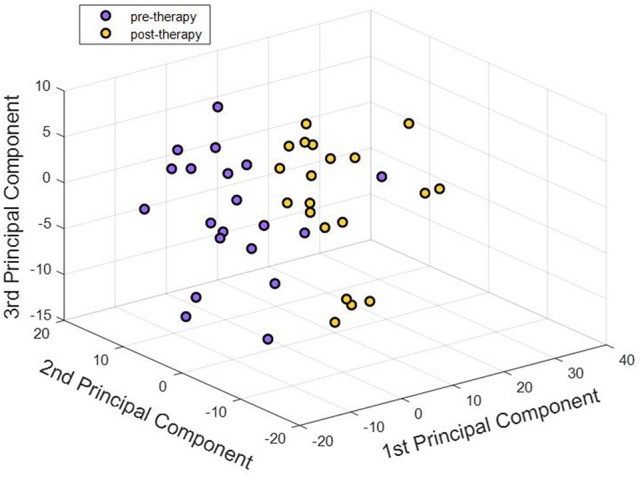
Figure 5.

First three principal components corresponding to pre-therapy rs-FC and post-therapy rs-FC for all participants were visualized. Each point in the 3-D plot corresponds to a participant. There appeared to be an almost clear separation between the two stages just with three principal components. Adding higher number of components better explained the variance in the data. Our analysis used 25 components that explained over 85% of the variance in the dataset.
