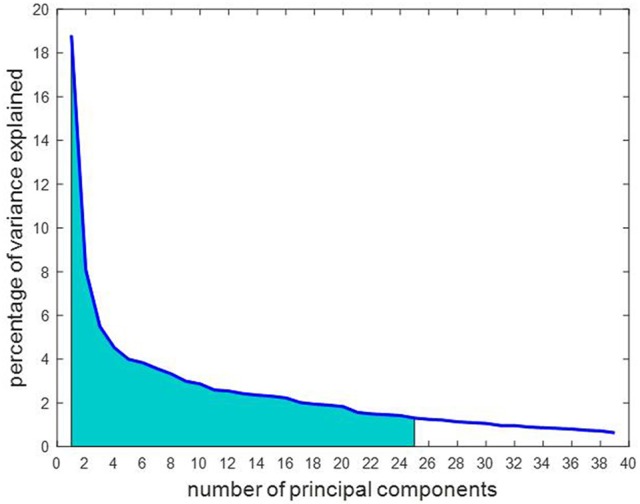
Figure 6.

The number of principal components are arranged in order of importance so that the first component accounts for the largest proportion of variance in the rs-FC data. Of the 39 principal components, 25 were chosen as marked in the graph as they cumulatively explained over 85% of the variance in the data, represented by the shaded area under the curve.
