
FIGURE 2.
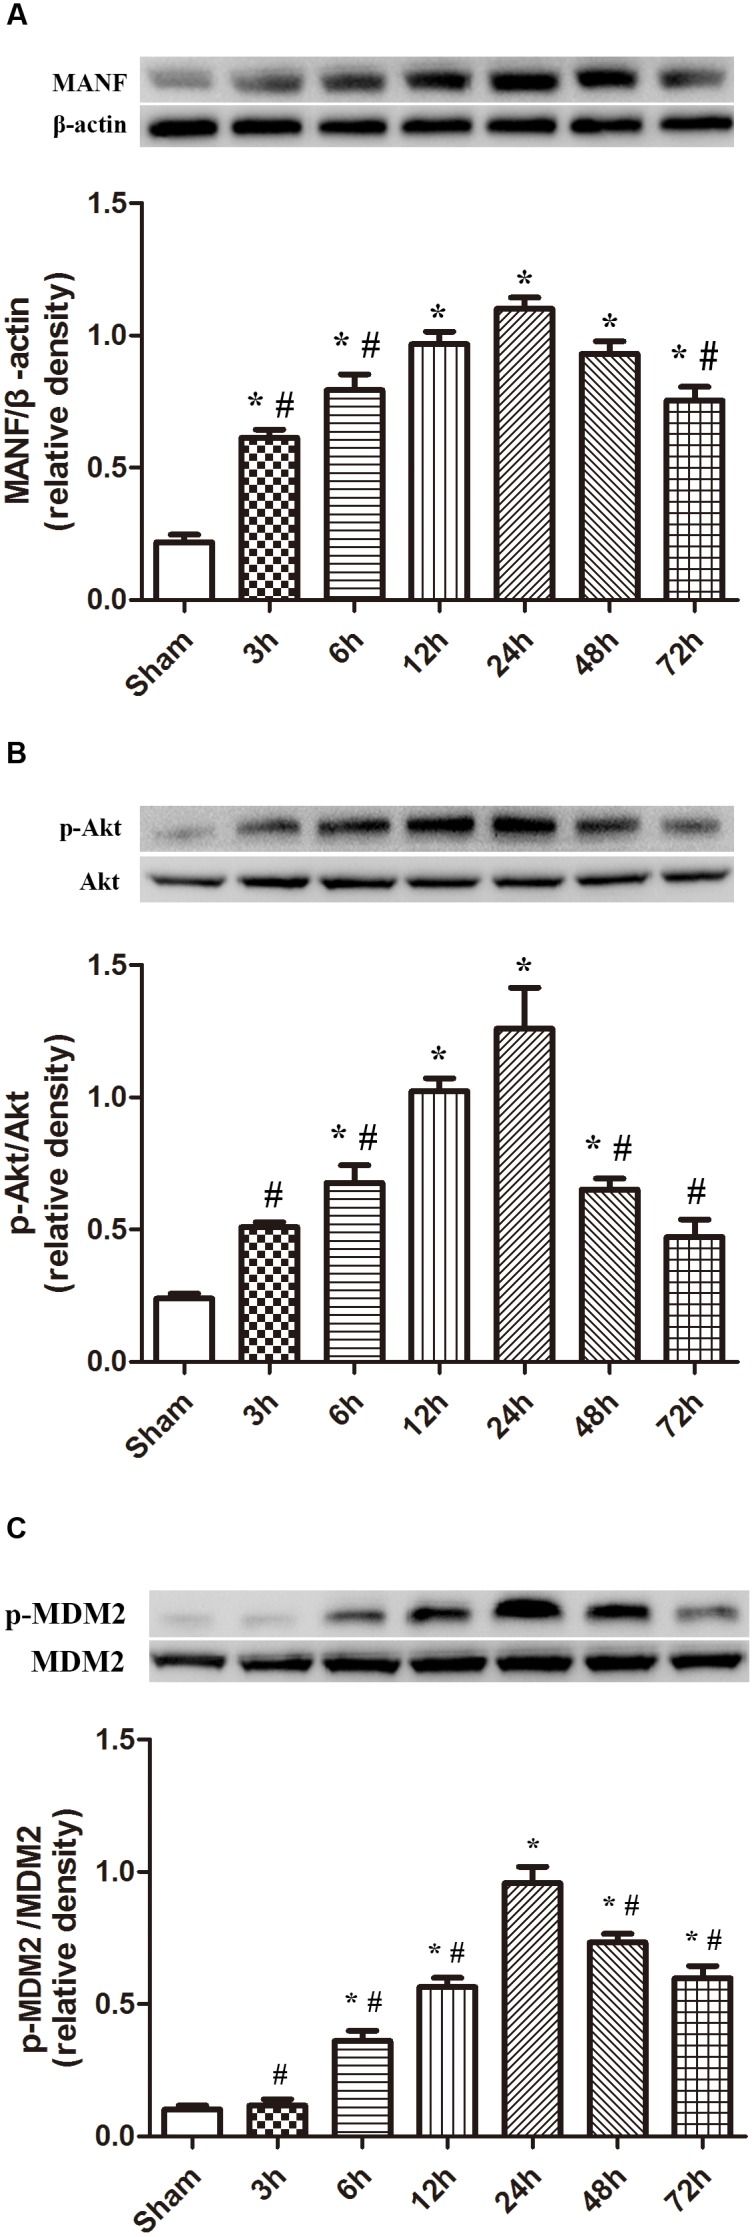
Expression of MANF, p-Akt and p-MDM2. (A) Time course of MANF in injured hemisphere after ICH; (B) Time course of p-Akt; (C) Time course of p-MDM2; n = 6 for each group. The bars represent the mean ± SD. ∗p < 0.05 vs. sham, #p < 0.05 vs. ICH at 24 h.