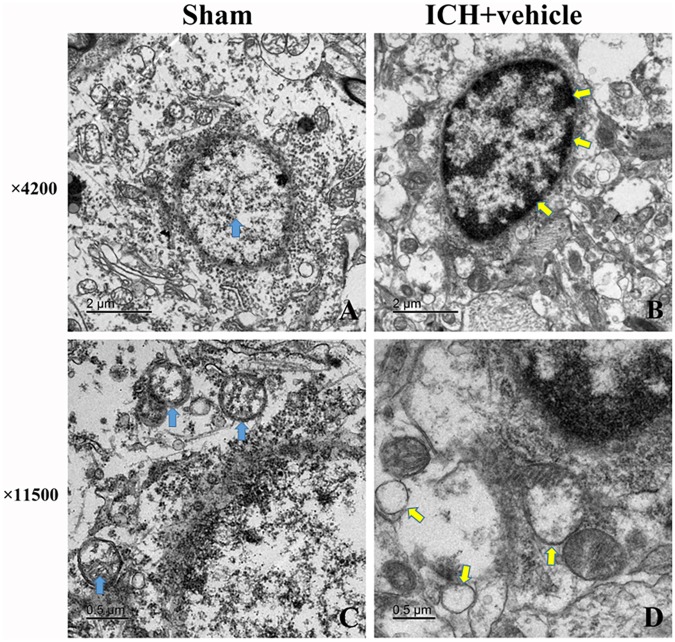
FIGURE 3.
Transmission electron microscopy images of the morphometric changes of brain tissues for sham group and ICH + vehicle group. (A) Sham, the arrow (green) indicated normal nucleus with homogeneous chromatin; (B) ICH+ vehicle (scar bar = 2 μm), the arrows (white) indicated abnormal nucleus with condensed chromatin; (C,D) Magnification of (A,B) (scar bar = 0.5 μm), the arrows(green) in (C) indicated normal mitochondria with intact prominent cristae, while arrows (white) in (D) indicated vacuole and swollen mitochondria.

