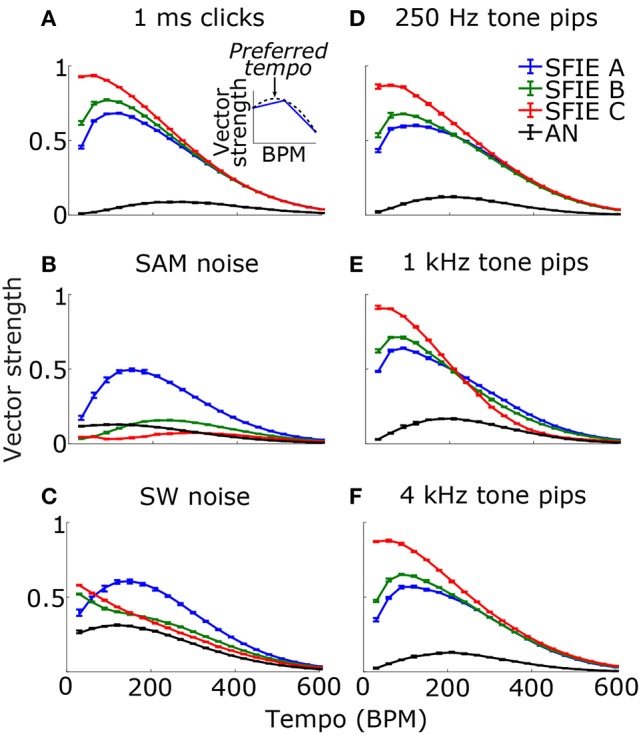
Figure 5.

Vector strength as a function of tempo in response to 1 ms clicks (A), SAM broadband noise (B), SW broadband noise (C), and tone pips with carrier frequencies of 250 Hz (D), 1 kHz (E), and 4 kHz (F). The vector strengths for the different SFIE models are color coded identically to Figure 4. Error bars designate interquartile ranges for 10 repetitions of each stimulus. The vector strength using the AN fiber activity alone, without an SFIE stage, is also shown in black. SFIE model A consistently produced peak vector strengths within the range of tempi typically associated with the “indifference interval” (around 100 BPM) and overlapping the range of tempi for dance music (van Noorden and Moelants, 1999). The preferred tempos were determined by quadratic interpolation. The black dashed line in the inset in (A) shows the quadratic fit to the points surrounding the maximum vector strength for SFIE A. The preferred tempo is equal to the peak of the quadratic fit. Preferred tempos and peak vector strengths are quantified in Table 2.
