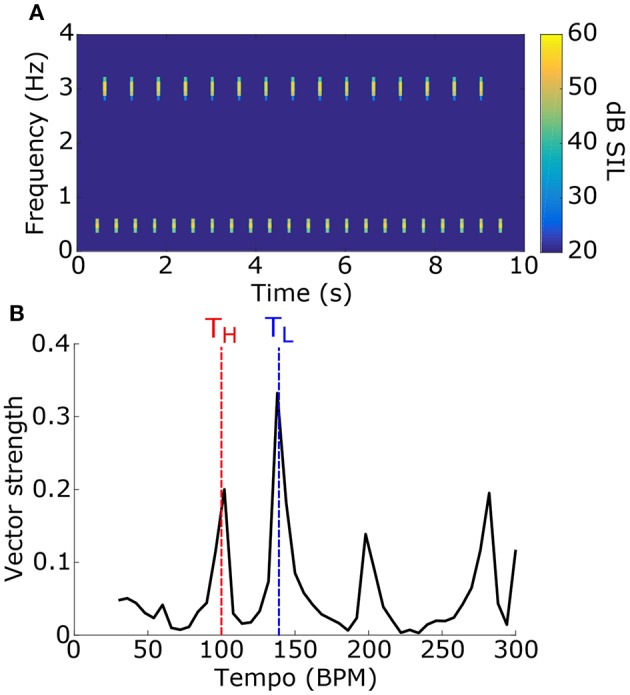
Figure 6.

(A) To test for a frequency bias in tempo induction, stimuli consisted of two sets of tone pips at two different carrier frequencies and different tempi. An example stimulus power spectrogram is shown (tone 1: fL = 500 Hz, TL = 140 BPM; tone 2: fH = 3 kHz, TH = 100 BPM; phase = 0 for both). (B) The vector strength as a function of tempo for the stimulus in (A) is shown. Dashed lines mark the tempi for the tone pips with the low-frequency carrier (blue) and the high-frequency carrier (red). The synchronization tempo was 138 BPM and the NST was 0.05, indicating that it is close to TL.
