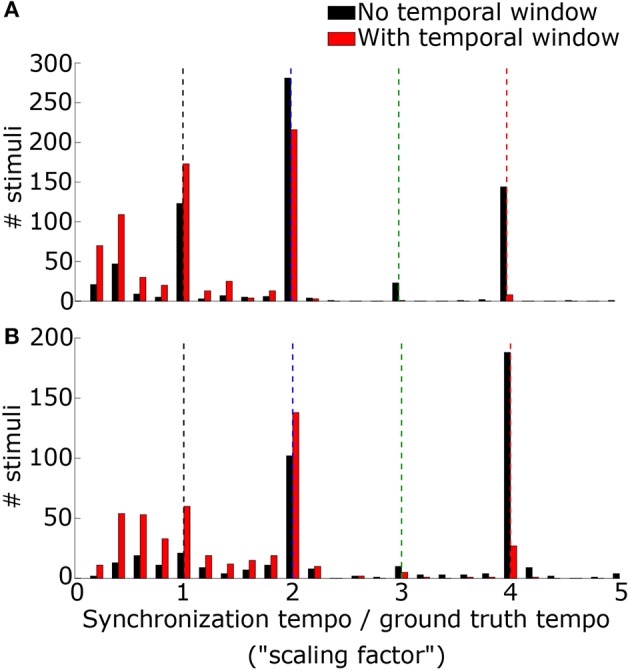
Figure 8.

The histogram of the ratio between the synchronization tempo and the ground truth tempo is plotted for the Ballroom dataset (A) and the Songs dataset (B) without the temporal Gaussian window applied (black) and with the temporal Gaussian window (red). Colored dashed lines mark the scaling factors of 1x (black), 2x (blue), 3x (green), and 4x (red).
