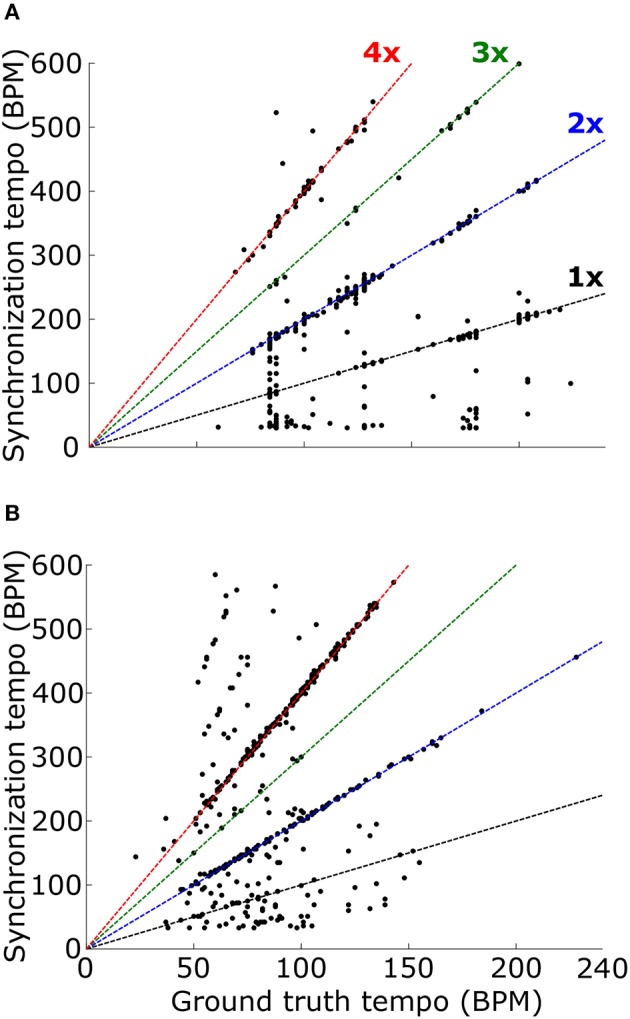
Figure 9.

Synchronization tempo using the vector strength of the summed PSTH without the temporal smoothing window is plotted as a function of the ground truth tempo for the Ballroom dataset (A) and the Songs dataset (B). Dotted lines mark the slopes corresponding to scaling factors 1–4, as in Figure 8. For the combined datasets (1163 stimuli total), 75.5% of the synchronization tempi fell within ±8% of these four slopes.
