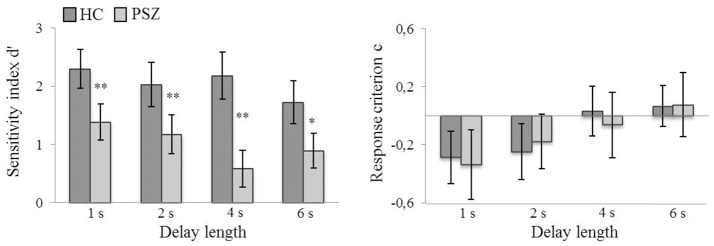
Figure 4.
Sensitivity (d′) and response criterion (c) at different delay lengths in patients with schizophrenia (PSZ) and healthy controls (HC). Error bars represent the standard error of the mean. Significant group differences at different delay lengths are marked. *indicates p < 0.05 and **indicates p < 0.01, corrected for multiple comparisons. Error variances were equal across groups for all delay lengths (Levene's test, p > 0.05). Participants' response strategy changed from more liberal (i.e., negative values signify a bias toward responding match) to more conservative (i.e., positive values signify a bias toward responding non-match) with longer delay lengths.

