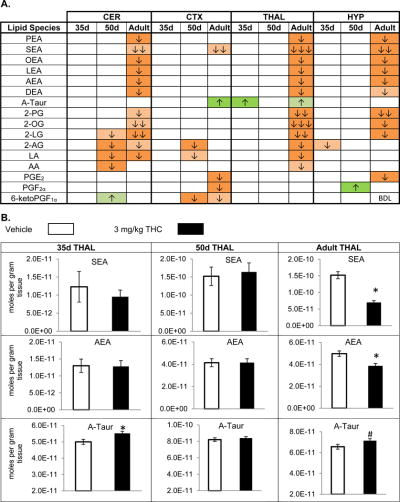
Figure 3. Effects of systemic 3 mg/kg Δ9-tetrahydrocannabinol (THC) on levels of targeted lipids 2 hours after injection in the post-natal day (PND) 35, PND 50, and adult CD1 female mouse cerebellum (CER), cortex (CTX), thalamus (THAL), and hypothalamus (HYP).
Panel A: Cells with shaded arrows indicate a change for that lipid in the THC-exposed brain area relative to the same vehicle-exposed area within each age group (35d = PND 35, 50d = PND 50, and AD = Adult). The arrow color indicates the direction of a significant result relative to control. Green colors represent increases, with darker green representing a significant (p < 0.05) increase and lighter green representing a trending (p < 0.1) increase. Orange colors represent decreases in a lipid’s concentration, with darker orange indicating a significant (p < .05) decrease and light orange representing a trending (p < .01) decrease. The number of arrows indicates the magnitude of the difference between THC and vehicle. One arrow indicates a magnitude difference of less than 1.5 fold, 2 arrows indicates a 1.5-1.99 fold change, and 3 arrows indicate a 2-2.99 fold change. BDL stands for “Below Detection Limit,” whereas a blank cell indicates that there was no change in the lipid’s level due to THC. See Methods and Supplemental Figure 3 for more detailed description of analysis. Lipids listed in this figure are N-palmitoyl ethanolamine (PEA), N-stearoyl ethanolamine (SEA), N-oleoyl ethanolamine (OEA), N-linoleoyl ethanolamine (LEA), N-arachidonoyl ethanolamine (AEA), N-docosahexaenoyl ethanolamine (DEA), N-arachidonoyl taurine (A-Taur), 2-palmitoyl glycerol (2-PG), 2-oleoyl glycerol (2-OG), 2-linoleoyl glycerol (2-LG), 2-arachidonoyl glycerol (2-AG), linoleic acid (LA), arachidonic acid (AA), prostaglandin E2 (PGE2), prostaglandin F2α (PGF2α), and 6-keto prostaglandin F1α (PGF1α).
Panel B: Bar graphs showing mean levels of N-stearoyl ethanolamine (SEA), N-arachidonoyl ethanolamine (AEA), and N-arachidonoyl taurine (A-Taur) in the post-natal day 35 thalamus (35d THAL), post-natal day 50 thalamus (50d THAL), and adult thalamus (adult THAL) 2 hours after a vehicle injection (open bars) or a 3 mg/kg THC injection (black bars). The units on the y-axis are moles of lipid per gram of tissue. Error bars are ± standard error. Asterisk (*) represents a difference of p < 0.05 between THC and vehicle groups and the pound sign (#) represents a difference of p < 0.1. In the post-natal day 35 and the post-natal day 50 thalamus, there are no significant differences in SEA or AEA levels between groups, but there is a significant decrease in both SEA (corresponding to an orange cell with 3 down arrows in panel A) and AEA (corresponding to an orange cell with 1 down arrow in panel A) in the adult thalamus. Levels of A-Taur were significantly higher in the THC-exposed post-natal day 35 thalamus (corresponding to a green cell with 1 up arrow in panel A) and were trending higher in the adult thalamus (corresponding to a lighter green cell with 1 up arrow in panel A).

