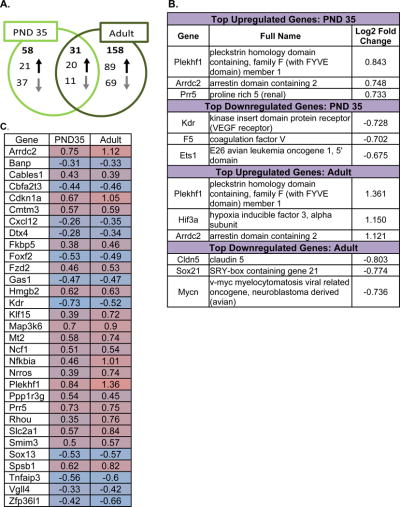
Figure 5. Effects of systemic 3 mg/kg Δ9-tetrahydrocannabinol (THC) on the transcriptome in the hippocampus of in the post-natal day (PND) 35 and adult female mice 2 hours post-injection.
Panel A: Venn diagram showing the number of significant changes in expression of transcripts due to acute THC relative to vehicle that were unique to each age group (PND 35 and adult) and the number of significant changes in transcript levels shared by each age group. The directionality of expression differences in the THC-treated group relative to the vehicle group is also shown. Full lists of the transcripts affected by acute THC in each age group can be found in Supplemental Figures 8 and 9.
Panel B: The top portion of this panel shows the transcripts with the largest magnitude significant differences in expression in the PND 35 THC-treated hippocampus versus the PND 35 vehicle-treated hippocampus. The full names for the 3 genes with the largest magnitude increase in expression and the 3 genes with the largest magnitude decrease in expression are written out and the log2 fold change is also shown here. The lower portion of this panel shows the transcripts with the largest magnitude significant differences in expression in the adult THC-treated hippocampus versus the adult vehicle-treated hippocampus. The full names for the 3 genes with the largest magnitude increase in expression and the 3 genes with the largest magnitude decrease in expression are written out and the log2 fold change is also shown here.
Panel C: Heat map of transcripts significantly affected by acute THC in the hippocampus of both PND 35 and adult mice. As shown in panel A of Figure 5, there were 31 transcripts with altered expression in both the PND 35 and the adult hippocampus. This panel shows the direction and magnitude of change for each of these 31 transcripts in the PND 35 and in the adult hippocampus. The shading color represents the direction of change: pink colors represent increases in expression in the THC group relative to vehicle, whereas blue colors indicate decreases in expression. The magnitude of change is expressed by the fold change in expression, which is written in each cell. For more information on the 31 transcripts affected by acute THC in both age groups, please refer to Supplemental Table 62, as well as Supplemental Figures 8-9.

