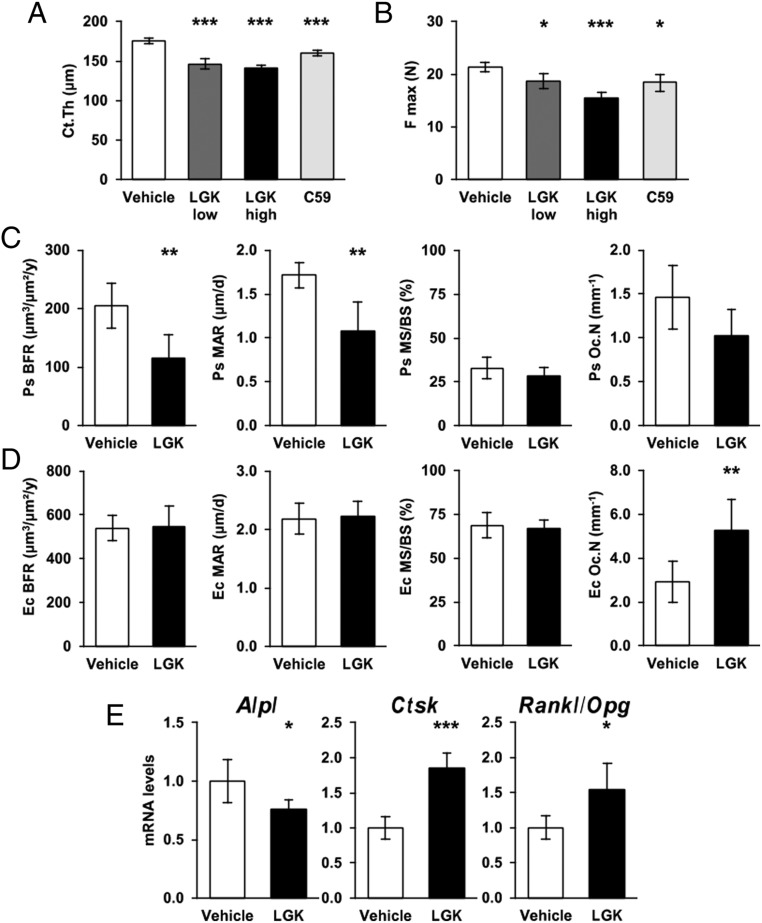
Figure 3.
Effects of Porcupine inhibition on cortical bone. (A) Cortical thickness (Ct.Th) of the femur assessed by µCT. (B) Maximal Failure load (F max) of the tibia from the 3-point bending test. (C) Bone histomorphometry at the periosteal surface of femur cortical bone showing periosteal bone formation rate (Ps BFR), mineralization apposition rate (Ps MAR), mineralizing surface over bone surface (Ps MS/BS) and osteoclast number per bone perimeter (Ps Oc.N). (D) Bone histomorphometry at the endocortical surface of femur showing endocortical bone formation rate (Ec BFR), mineralization apposition rate (Ec MAR), mineralising surface over bone surface (Ec MS/BS) and osteoclast number per bone perimeter (Ec Oc.N). (E) Alpl, Ctsk and Rankl/Opg ratio mRNA levels in cortical bone. For each graph, n = 10 animals per group. Bars represent the mean and error bars represent the 95% CI of the mean. P values are indicated as *P < 0.05; **P < 0.01; ***P < 0.001.

 This work is licensed under a