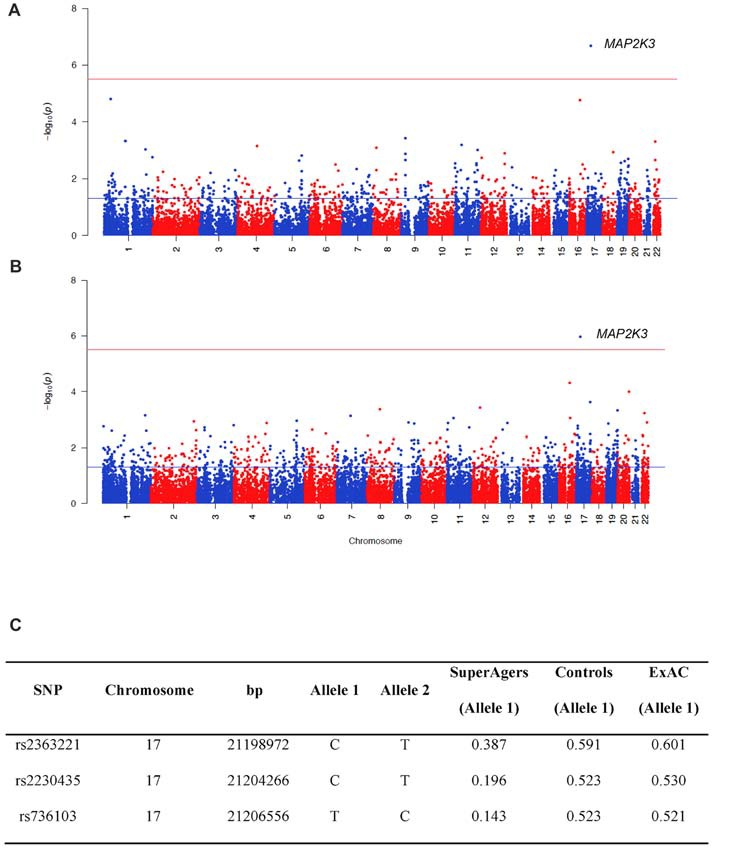
Figure 1.

Manhattan plots showing the results of the Sequence Kernel Association Combined (SKAT-C) analysis between SuperAgers and Alzheimer’s disease neuroimaging initiative (ADNI) controls, without covariates (A) and with covariates (B) included in the model. The red line indicates the significance threshold after Bonferroni correction (p = 3.09E-06), whereas the blue line indicates the nominal significance threshold (p = 0.05). (C) Allele frequencies for the single nucleotidepolymorphisms (SNPs) in the Mitogen-Activated Protein Kinase Kinase 3 (MAP2K3) gene in SuperAging, Control and ExAC cohorts (European non-Finnish population sample).
