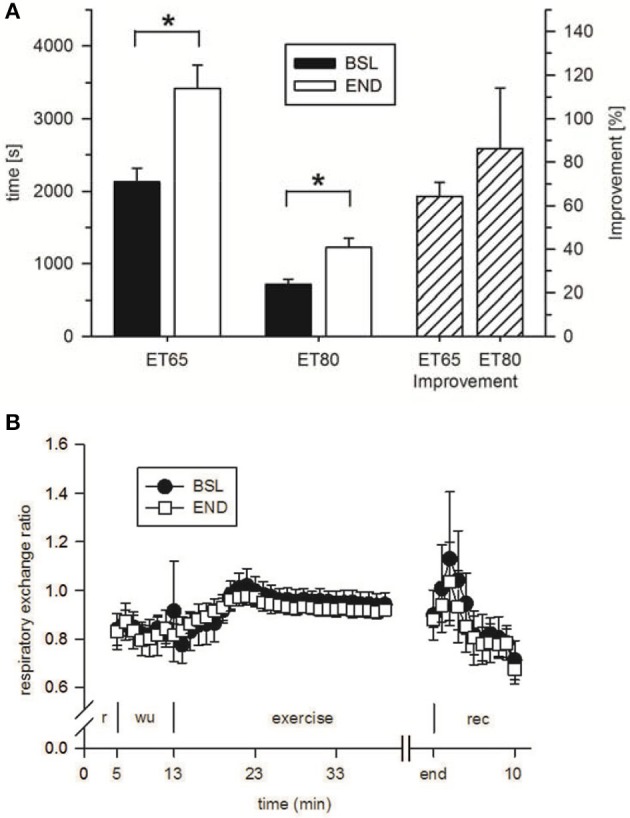
Figure 6.

Analysis of (A) time-to-exhaustion in endurance tests at 65% Pmax (ET65) and 80% Pmax (ET80) at baseline (BSL) testing before the start of the HIHVT and at endpoint (END) testing after the entire HIHVT. Data are presented as means ± SE. ET65 and ET80 improvement: % improvement in time-to-exhaustion at END compared to BSL testing. *Significantly different from BSL testing, p < 0.05. Analysis of (B) respiratory exchange ratio in endurance tests ET65 at BSL and END testing. Data are presented as means ± SE. Minutes 0–5: rest (r) on the cycle ergometer; min 6–13: 2 min running-in at 10 Watt (W) followed by 6 min warm-up (wu) at 30% maximum power (Pmax); endurance test to exhaustion at 80% Pmax (exercise); recovery (rec); end: end of the test.
