Figure 9.
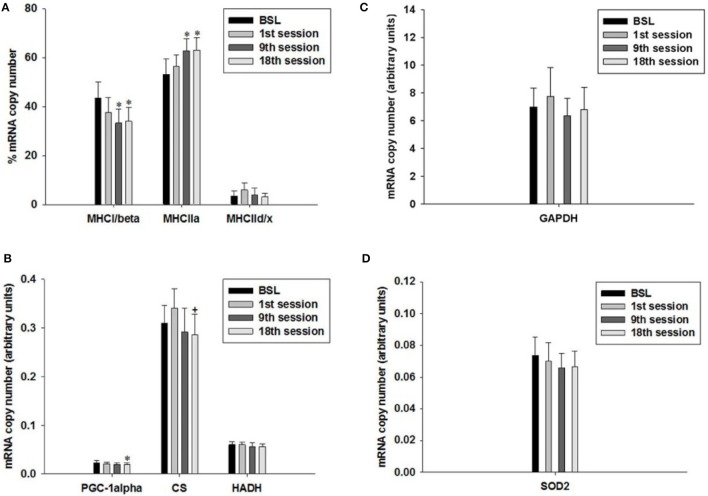
Quantitative real-time PCR (qPCR) analysis of mRNA expression of (A) myosin heavy chain (MHC) isoforms I/β, IIa, and IId/x, (B) peroxisome proliferator-activated receptor gamma coactivator 1α (PGC-1α), citrate synthase (CS) and hydroxyacyl-CoA dehydrogenase (HADH) as markers of oxidative energy metabolism, (C) glyceraldehyde-3-phosphate dehydrogenase (GAPDH) as a marker of glycolytic energy metabolism, and (D) mitochondrial superoxide dismutase 2 (SOD2) as a marker of radical metabolism. Muscle biopsies were taken before the start of the HIHVT at baseline (BSL) testing, after the first (1st), ninth (9th), and eighteenth (18th) training session. MHC isoform expression is shown as percentage of total MHC isoform mRNA copies (set to 100%). The mRNA expression of other marker genes is shown in arbitrary units. Data are presented as means ± SE. *Significantly different from BSL testing, p < 0.05; +Significantly different from the first training session, p < 0.05.

