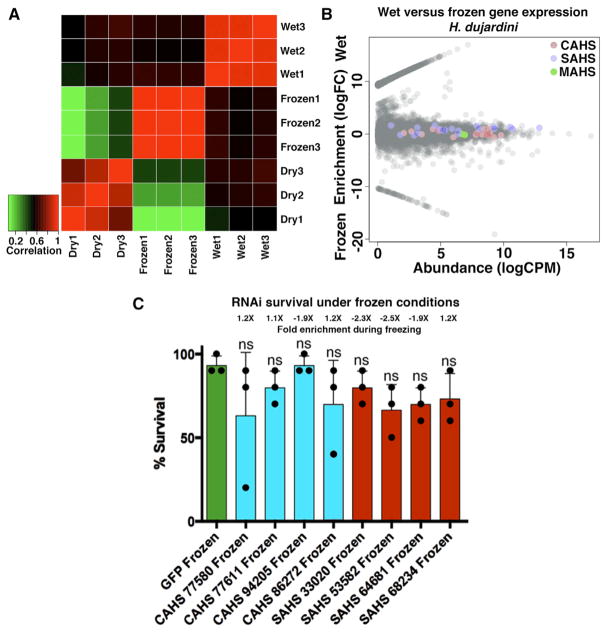
Figure 5. Divergence in H. dujardini’s Response to Drying and Freezing.
(A) Heatmap showing correlation between expression profiles of transcriptomes derived from dry, frozen, and hydrated H. dujardini specimens.
(B) MA plots showing the enrichment (log2 fold change) versus abundance (log2 CPM) of transcripts under control (hydrated) and frozen conditions in H. dujardini. Colored circles represent CAHS (red), SAHS (blue), and MAHS (green) TDPs.
(C) Survival under frozen conditions of H. dujardini specimens injected with RNAi constructs targeting control (green), CAHS (blue), and SAHS (red) genes. Dots represent individual trials with n = 10 for each individual trial (30 total). t test: ns = not significant. RNA abundance fold change values given above each bar (e.g., 1.2×) indicate the increase in abundance of that transcript in frozen relative to hydrated conditions.
Error bars, SD.

