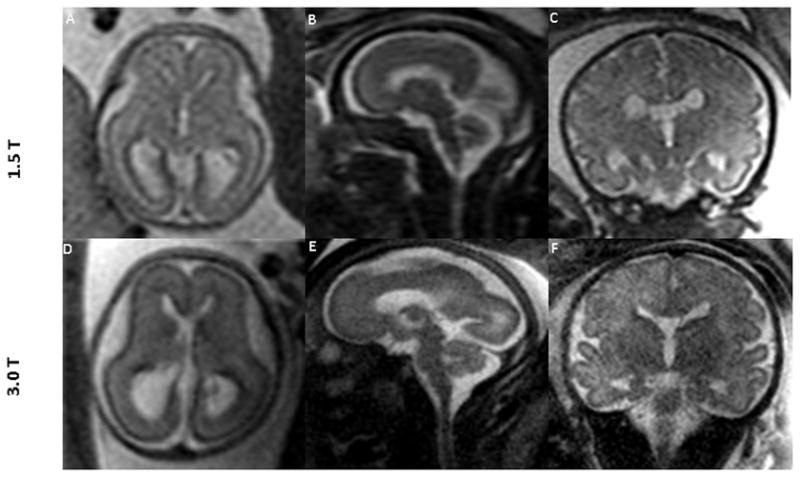
Figure 4.

1.5T MR images of the fetal brain (top row) and the corresponding 3.0T images (bottom row) across different gestational ages. Data were obtained from 3 different fetuses. Images in the top row and the corresponding images in the bottom row are from the same fetus. Gestational age (weeks) at the time of scan were: (A: 22, D: 22 3/7); (B: 27, E: 27 2/7); and (C and F: 35 1/7). Superior tissue contrast and conspicuity is demonstrated in the 3.0T images.
