
Figure 5. Mitochondrial respiration and electron transport chain complex activities during type 2 diabetes mellitus.
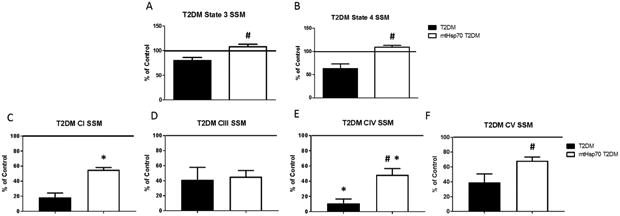
Mitochondrial (A) state 3 and (B) state 4 respiration rates in SSM from mtHsp70 db/db and db/db mice. ETC complex activities in SSM from mtHsp70 db/db and db/db mice in (C) complex I, (D) complex III, (E) complex IV, (F) and ATP synthase. Control (n = 6), db/db (n = 5), mtHsp70 (n = 5), and mtHsp70 db/db (n = 5) for both SSM and IFM mitochondrial respiration and electron transport chain complex activities. Values are expressed as means ± SEM. Solid line = control levels (average value of measurements); T2DM = type 2 diabetes mellitus; CI = complex I; CIII = complex III, CIV = complex IV. *P ≤ 0.05 for control vs. T2DM. #P ≤ 0.05 for T2DM vs. mtHsp70 T2DM.