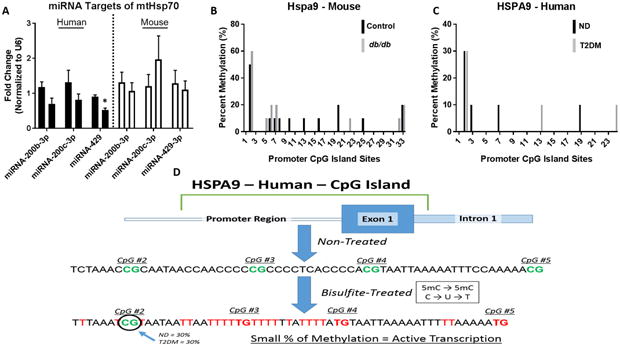
Figure 7. MiRNA targets and CpG island methylation for HSPA9 and Hspa9.

(A) ND (left, n = 6) versus T2DM (right, n = 6) miRNA expression levels predicted to target HSPA9 in human patient right atrial tissue (black bars) and control (left, n = 6) versus db/db (right, n = 6) miRNA expression levels predicted to target Hspa9 in mice whole heart (white bars). (B) CpG island methylation in the promotor region of Hspa9 in control (black, n = 6) versus db/db (grey, n = 6) mice. (C) CpG island methylation in the promotor region of HSPA9 in non-diabetic (black, n = 6) versus type 2 diabetic (grey, n = 6) human patient samples. For both human and mouse CpG methylation, 10 clones were selected from each group. (D) An overview of the process for measuring and analyzing CpG island methylation at the HSPA9 promoter region, revealing limited methylation in both the control and diabetic cohort. Values are expressed as means ± SEM; *P ≤ 0.05 for control vs. T2DM. MiRNA analyses were normalized to U6. HSPA9 = Heat Shock Protein Family A (Hsp70) Member 9, ND = non-diabetic, T2DM = type 2 diabetes mellitus.
