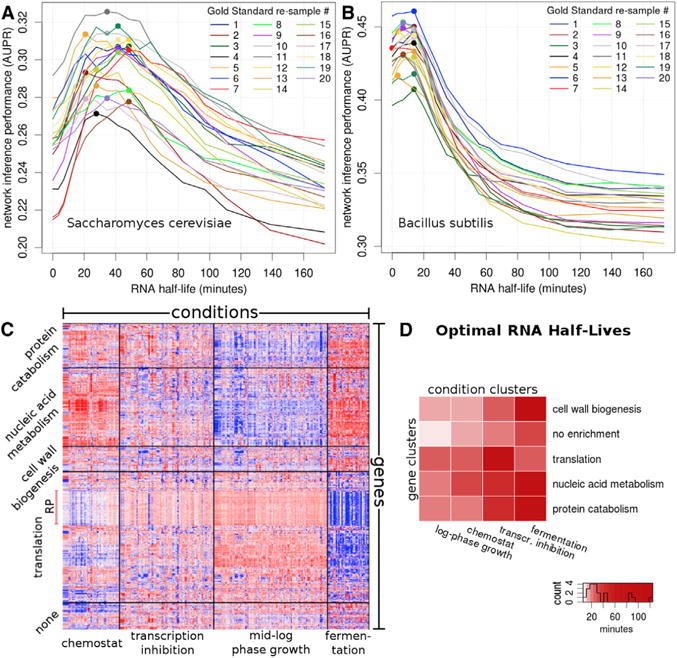
Figure 1. Network Inference Is Sensitive to RNA Half-Lives in Both Eukaryotes and Pro-karyotes in a Condition- and Gene-Specific Manner.

(A and B) AUPR is shown as a function of preset RNA half-life (A) in Saccharomyces cerevisiae and (B) in Bacillus subtilis. Each line denotes one of the 20 independent gold standard re-samples, and colored dots represent the maximum AUPR for a given re-sample.
(C) Over two thousand expression datasets group into 20 bi-clusters (unrelated to 20 Gold Standard re-samples) with gene- and condition-specific properties. Red and blue denote high and low expression levels, respectively. Gene cluster names correspond to the most highly enriched function category. Condition cluster names represent the most highly enriched terms in the meta-data. The heatmap shows the 997 genes from the Gold Standard. Note that the final network was derived from expression data of 5,716 genes mapped onto these clusters.
(D) Shades of red denote the optimal half-life, in minutes, for each of the 20 bi-clusters. The color scale is devised to discriminate half-lives < 50 min, which contain 16/20 of the predictions.
For the full plot of AUPR and AUROC trajectories for every bi-cluster, see Figures S4 and S5, respectively. See also Figures S1 and S6A–S6H.
