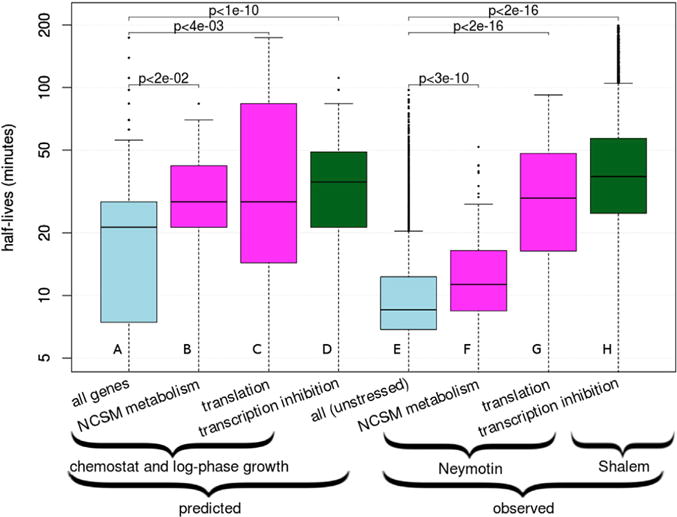
Figure 2. InfereCLaDR Recapitulates Known Differences between RNA Half-Lives of Different Genes and Conditions and Identifies New Relationships.

(A–H) The boxes show median RNA half-lives with the first and third quartiles. (A)–(D) show the distribution of predicted values across 20 Gold Standard re-samples, and (E)–(H) show values measured experimentally across genes. Predicted values are produced by InfereCLaDR; observed values are from experimental datasets. Magenta color denotes minimally perturbed conditions (i.e., chemostat and log phase growth) (predicted) and Neymotin et al. (2014) experimental data for subsets of genes; i.e., nucleobase-containing small-molecule metabolism (NCSM) and translation. We highlight the NCSM category because its high half-lives was the most prominent predicted pattern under minimally perturbed conditions. Light blue denotes all genes predicted or observed under unperturbed conditions. Green denotes half-lives of all genes predicted or observed under conditions of transcription inhibition (Shalem et al., 2008). See also Figure S4.
