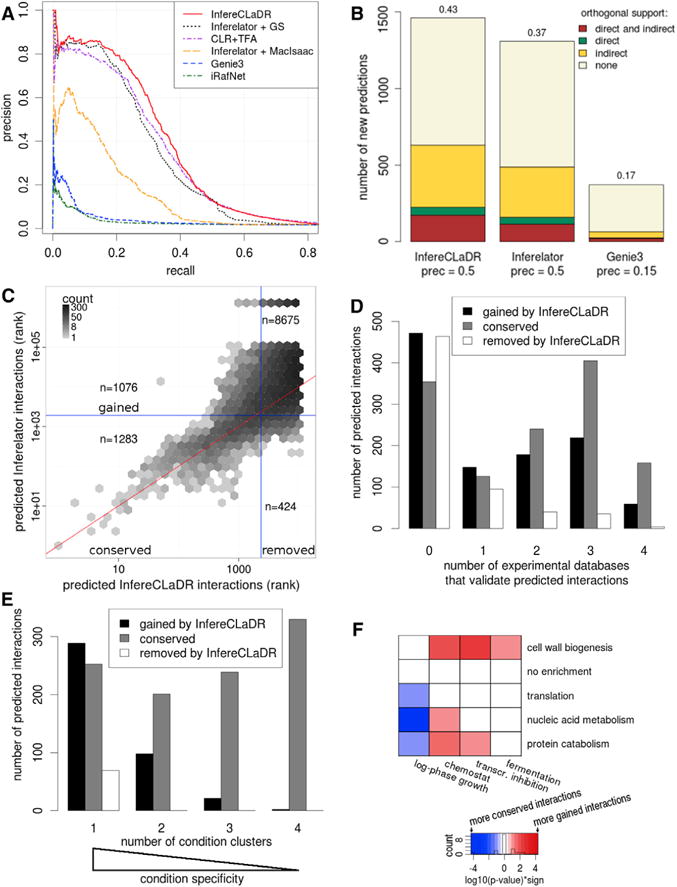
Figure 3. InfereCLaDR Outperforms Previous Network Inference Approaches by Predicting New High-Confidence Condition-Specific Interactions.

(A) The improvement in the precision-recall curve is a result of the use of a high-quality Gold Standard, bi-cluster specific network inference, and optimization of bi-cluster specific RNA half-lives. We compare InfereCLaDR (red line) with Inferelator without bi-clustering or half-life optimization (black dotted line), with the Inferelator using the MacIsaac gold standard of interactions (orange dashed line), and with context likelihood of relatedness (CLR), Genie3, and iRafNet (purple dash-dotted line, blue dashed line, and green dash-dotted line, respectively). Each curve is constructed using median precision and recall values across 20 re-samples. For improvement based on AUROC, see Figure S1F.
(B) The number of new predicted interactions (i.e., interactions not in the Gold Standard), obtained using the optimized bi-cluster-specific half-lives and the full Gold Standard for training, compares favorably with new predictions from the original Inferelator and from Genie3. The height of a section within each bar corresponds to the number of new interactions that were confirmed by the corresponding type of evidence in orthogonal data. Direct evidence refers to physical protein-DNA interactions, and indirect evidence refers to knockout and overexpression assays (Table S1). The number above each bar denotes the fraction of new interactions supported by at least one orthogonal source. Prec, precision.
(C) High-scoring regulatory interactions correlate between InfereCLaDR and Inferelator, but InfereCLaDR predicts many new interactions. The vertical and horizontal blue lines show the precision = 0.5 rank cutoff for InfereCLaDR and Inferelator, respectively (Supplemental Experimental Procedures). The lower the rank, the higher the confidence in the prediction. The red line maps the InfereCLaDR rank to the same rank in Inferelator. See also Figures S6I–S6K.
(D) Most (56%) regulatory interactions that were newly predicted by InfereCLaDR have orthogonal support to validate them. In comparison, Inferelator’s predictions that were removed in InfereCLaDR have little support, suggesting that they had been false positives. Black bars denote the bottom right quadrant in (C) (gained), gray bars denote the top left quadrant in (C) (lost), and white bars denote the interactions in the bottom left quadrant of (C) (conserved).
(E) InfereCLaDR’s gained interactions are often specific to experimental conditions. Each bar displays how many regulatory interactions were above the rank-based cutoff (Supplemental Experimental Procedures) for the given number of clusters. Interactions that only appear in one cluster are very condition-specific, whereas interactions that appear in all four clusters are more general and independent of experimental conditions. The graph shows only the high-confidence predictions that were above the cutoff for at least one cluster prior to rank-combining.
(F) InfereCLaDR’s gained predictions are often specific to non-standard conditions. Each interaction was assigned a bi-cluster based on the gene cluster of the target gene and a condition cluster in which this interaction had the best rank. Red cells represent bi-clusters with significantly more gained interactions, blue cells represent bi-clusters with significantly fewer gained interactions, and white cells represent no enrichment (Supplemental Experimental Procedures).
