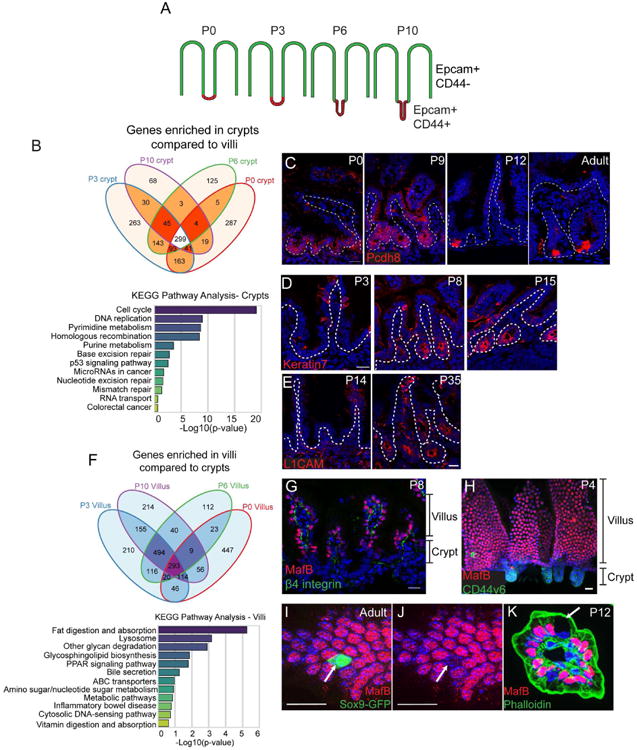
Figure 2. Identification of core crypt-enriched and villar-enriched genes in the postnatal intestine.

(A) Schematic for FACs sorting strategy. Stages of CD1 mice are listed above each intestinal image. Epcam marks all epithelial cells, while CD44 marks intervillar cells. (B) Venn diagram illustrating the number of genes enriched in crypts compared to villi (at least 2-fold, p < .05) at each stage. A total of 299 genes were enriched in crypts compared to villi at all stages examined. Below is a graph of KEGG pathway terms for genes enriched in crypts versus villi at all stages examined. (C) Staining of the crypt-enriched marker Pcdh8 (PAPC, red) in the medial small intestine at indicated stages. Pcdh8 is broadly expressed in crypts from P0-P9, then becomes enriched in cells at the base of the crypt by P12. The dotted line marks the basement membrane. (D) Keratin 7 (red) staining in P3, P8, and P15 crypts showing its induction at late stages of crypt morphogenesis. (E) L1CAM (red) staining in P14 and P35 crypts showing its induction after morphogenesis is complete. (F) Venn diagram illustrating the number of genes enriched in villi compared to crypts (at least 2-fold, p < .05) at each stage. Below is a graph of KEGG pathway terms for genes enriched in villi compared to crypts at all stages examined. (G) MafB (red) and β4 integrin (green) localization in an intestinal tissue section. MafB is exclusively expressed in cells in the villi. (H) Whole mount staining of MafB (red) and CD44v6 (green). (I-J) MafB (red) staining of a Sox9-GFP (green) intestine. The arrow indicates a Sox9-GFP-positive villar cell that is negative for MafB staining. (K) MafB (red) and phalloidin (green) staining of a villus in cross-section. The arrow indicates a Goblet cell, which does not express MafB. All scale bars are 20 μm. For RNA-seq, 5-10 littermates were pooled for each RNA-seq sample. See also Figures S2 and S3.
