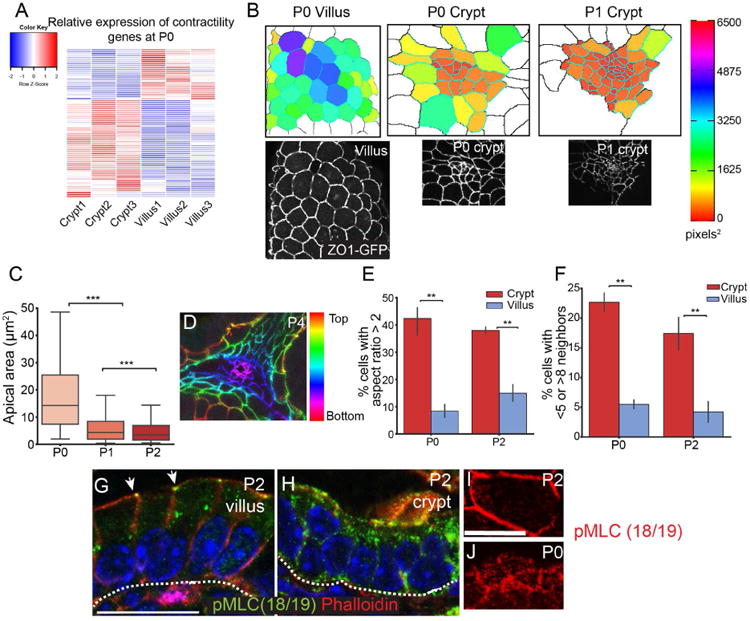
Figure 3. Intervillar cells are apically constricted.

(A) Heatmap of myosin II-associated contractility gene expression in P0 crypts and villi, based on HT-seq gene count data. (B) Images of apical regions of developing crypts and villi, as indicated. The lower panels are epifluorescence images of ZO1-GFP mice, as indicated. The upper panels are segmented images in which cells are colored by their apical area. (C) Quantification of apical area of crypt cells between P0 and P2. The box boundaries are the 25th and 75th percentiles, and the whiskers are the 5th and 95th percentiles. ANOVA, p < 0.05; P0 vs. P1 Tukey HSD, p < 0.001; P1 vs. P2 Tukey HSD, p < 0.001. (D) Depth-coded maximum projection of an invaginating crypt. ZO1-GFP is pseudo-colored by z-position. (E) Percentage of cells in the crypt or villus that have an aspect ratio greater than 2. (F) Percentage of cells in the crypt or villus that have fewer than 5 or more than 8 neighbors. For bar plots, the error bars are the SEM. T-test; ***, p < .001, **, p < .01, *, p < .05. (G,H) phospho-myosin light chain (Thr18/Ser19) staining in villi (G) and crypts (H). pMLC is primarily localized to the zonula adherens in villi (arrows). Scale bar, 20 μm. (I, J) En face view of a villar cell (I) and crypt cells (J) stained for pMLC (red). Scale bar, 20 μm. For apical constriction measurements, 2-3 mice were analyzed per stage, and more than 100 crypt cells per mouse were measured. For panels E-F, 3 mice were analyzed per stage, and more than 25 cells per mouse were measured. See also Tables S1 and S2.
