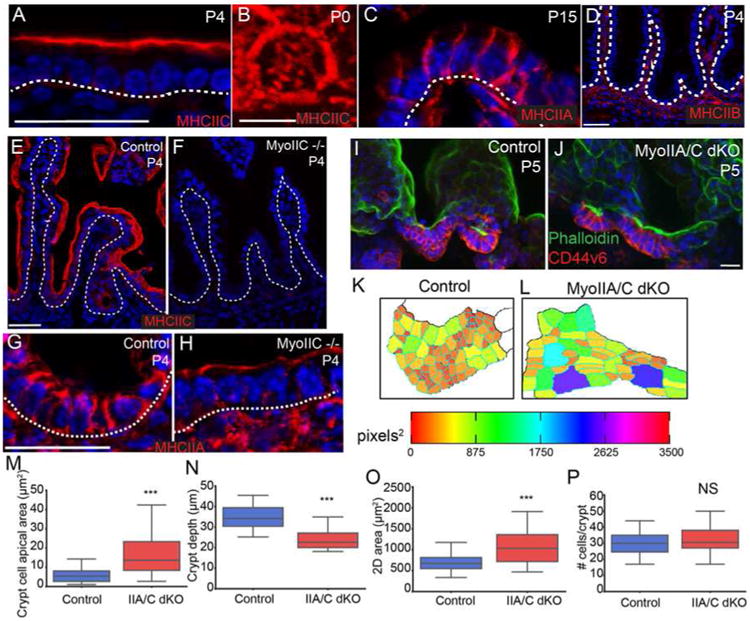
Figure 4. Myosin-II mediated contractility is required for crypt invagination.

(A) Myosin IIC localization (red) at the apical side of intestinal epithelial cells. The basement membrane is marked with a dotted line. (B) En face view of myosin IIC localization in the apicomedial region of an intestinal epithelial cell. (C) Myosin IIA localization (red) to the lateral membranes of intestinal epithelial cells. The basement membrane is marked with a dotted line. (D) Myosin IIB is not expressed in the intestinal epithelium. Basement membrane is marked with a dotted line. (E,F) Staining of myosin IIC (red) in control and myoIIC -/- intestines, confirming loss of protein. The basement membrane is marked by a dotted line. (G,H) Staining of myosin IIA (red) in control and MyoIIC -/- intestines. In the absence of myosin IIC, myosin IIA localizes to the apical region of intestinal epithelial cells. Basement membrane is marked by a dotted line. (I,J) Maximum intensity projections of epithelial sheets from control (I) and MyoIIA/IIC double KO intestines (J) at P5. Epithelial sheets are stained for phalloidin (green) and CD44v6 (red). (K,L) Segmented images of apical regions of developing crypts are color coded by apical area for control and MyoIIA/IIC double KO intestines. (M) Quantification of apical area of crypt cells in control and MyoIIA/IIC double KO P5 intestines. (N) Quantification of crypt depth in control and MyoIIA/IIC double KO P5 intestines. (O) Quantification of 2D crypt area in control and MyoIIA/IIC double KO P5 intestines. (P) Quantification of the number of CD44v6+ cells per crypt. There is no difference in crypt cell number in the MyoIIA/IIC double KO compared to controls. For box and whisker plots, the boxes mark the 25th to 75th percentile, and the whiskers mark the 5th and 95th percentiles. ***, p < .001 by student's t-test. NS, not significant. All scale bars are 20 μm, with the exception of (B), where it is 5 μm. Total number of mice analyzed were three mice per genotype, and more than 20 cells per mouse. See also Figure S4.
