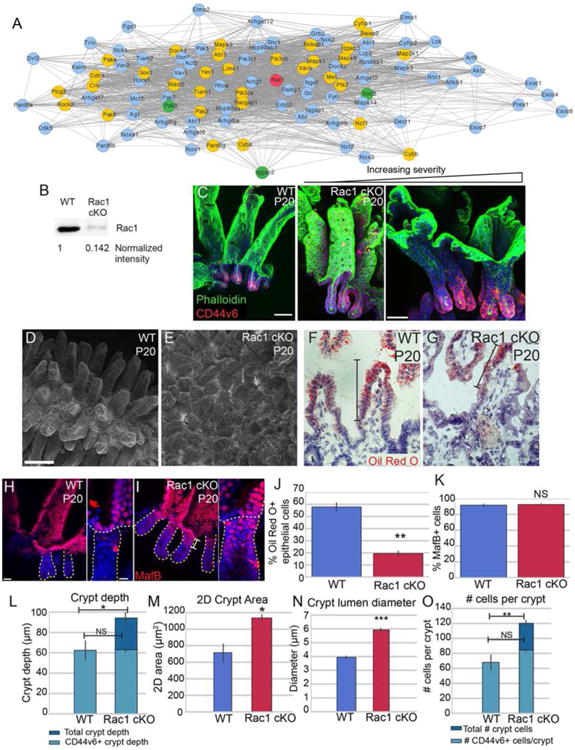
Figure 5. Loss of Rac1 causes dramatic architectural changes in the small intestine.

(A) STRING network of Rac1-interacting proteins. Rac1 is marked in red. Gold nodes are genes that were identified by RNA-seq to be enriched in crypts over villi at one or more stage. Green nodes are genes identified by RNA-seq to be enriched in villi over crypts at one or more stage. (B) Western blot of isolated intestinal epithelium from P20 VilCreER; Rac1 fl/fl (Rac1 cKO) or control littermates injected with tamoxifen at P0. The amount of Rac1 was normalized to total protein. (C) Maximum intensity projections of P20 control or Rac1 cKO intestinal epithelial sheets stained for phalloidin (green) and CD44v6 (red). The first panel is from a WT intestine, and the remaining two panels are from Rac1 cKO intestines, illustrating the variation in the severity of the phenotype. Scale bar, 50 μm. (D-E) Scanning electron microscopy of P20 WT (D) and Rac1 cKO (E) intestines. Scale bar, 100 μm. (F-G) Oil Red O and Hematoxylin staining of P20 WT (F) and Rac1 cKO (G) intestinal sections after 30 min oil gavage. Brackets mark the region of the villus that contains Oil Red O-positive puncta. Scale bar, 20 μm. The saturation level of Oil Red O staining was adjusted for both images in Photoshop. (H-I) Epithelial whole mount staining of MafB (red) in WT (H) and Rac1 cKO (I) P20 intestines. Insets show MafB staining in the uppermost region of a single crypt. Individual crypts are marked by a dotted line. Scale bar, 25 μm. Scale bar in insets is 10 μm. (J) Bar plot of the percentage of epithelial cells that were positive for Oil Red O staining. (K) Bar plot of the percentage of CD44v6-negative epithelial cells that stained positive for MafB. (L) Quantification of crypt depth in WT and Rac1 cKO P20 intestines. Note that in WT crypts, all cells are CD44v6+. (M) Quantification of 2D crypt area in WT and Rac1 cKO P20 intestines. (N) Quantification of the lumen diameter of crypts in WT and Rac1 cKO P20 intestines. (O) Quantification of number of cells per crypt. Note that in WT crypts, all cells are CD44v6+. For bar plots, the error bars are the SEM. ***, p < .001, **, p < .01, *, p < .05, NS = not significant. Total number of mice analyzed were 3-5 mice per genotype, and at least 15 crypts per mouse. See also Figure S5.
