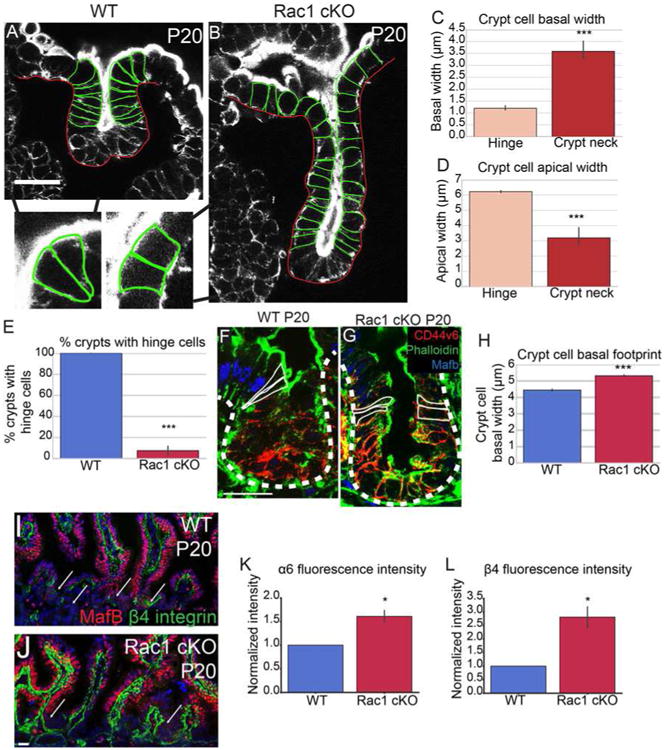
Figure 6. Loss of Rac1 increases hemidesmosomal attachments and inhibits hinge cell formation.

(A-B) Phalloidin staining of P20 WT (A) or Rac1 cKO (B) crypts. Yellow arrowheads in A mark “hinge cells”, the cells at the mouth of the crypt that are basally constricted and apically expanded. Insets show zoomed in regions of hinge cells with the cell boundaries outlined. (C) Quantification of basal width of hinge cells and cells within the crypt neck. (D) Quantification of the apical width of hinge cells and cells within the crypt neck. (E) Quantification of the percent of WT or Rac1 cKO P20 crypts that contain identifiable hinge cells. (F-G) MafB (blue), Phalloidin (green) and CD44v6 (red) staining in P20 crypts. Cells within the hinge region are outlined in white. (H) Quantification of the basal footprint of cells in P20 WT and Rac1 cKO crypts. (I-J) MafB (red) and β4 integrin staining (green) in tissue sections from P20 WT and Rac1 cKO intestines. Arrows point to crypts. (K-L) Normalized fluorescence intensity of α6 integrin (K) and β4 integrin (L) in P20 WT and Rac1 cKO crypts. All scale bars are 20 μm. For all bar plots, the error bars are the SEM. ***, p < .001, **, p < .01, *, p < .05. Total number of mice analyzed were 3-5 mice per genotype, at least 23 crypts per mouse or least 100 cells per mouse. See also Figures S6 and S7.
