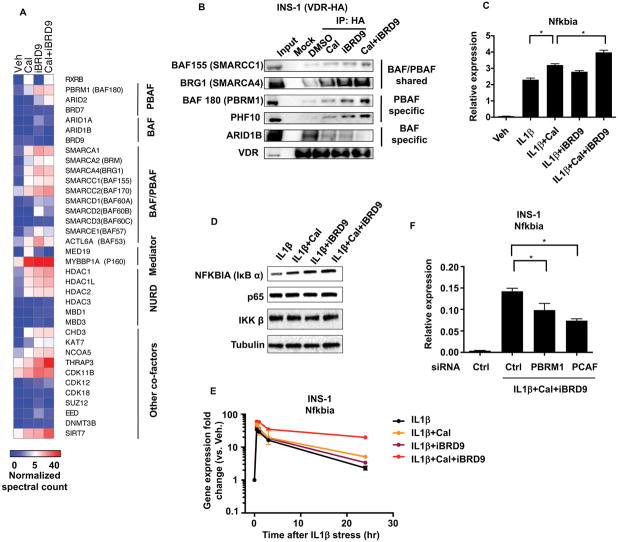
Figure 3. BRD9 represses VDR activation upon acute cytokine stress in β cells.
(A) Heat map of VDR interactome in INS1 cells expressing HA-tagged VDR treated with vehicle, Cal, iBRD9, or Cal+iBRD9. Spectral counts normalized to VDR.
(B) Western blots of immunoprecipitates from INS1 cells expressing HA-tagged VDR with indicated treatments.
(C) Expression of Nfkbia in INS1 cells 30 minutes after exposure to IL1βand indicated co-treatments.
(D) Western bolt of NFKBIA (IκBα) in INS1 cells 30 minutes after exposure to IL1β with and without Cal, iBRD9, or Cal+iBRD9.
(E) Time course of Nfkbia expression in INS1 cells in response to IL1β with indicated treatments.
(F) Nfkbia levels in IL1β-stressed INS1 cells with siRNA knock down of PBRM1 or PCAF.
n=3, mean±S.E.M., *P<0.05
See also Figure S4.

