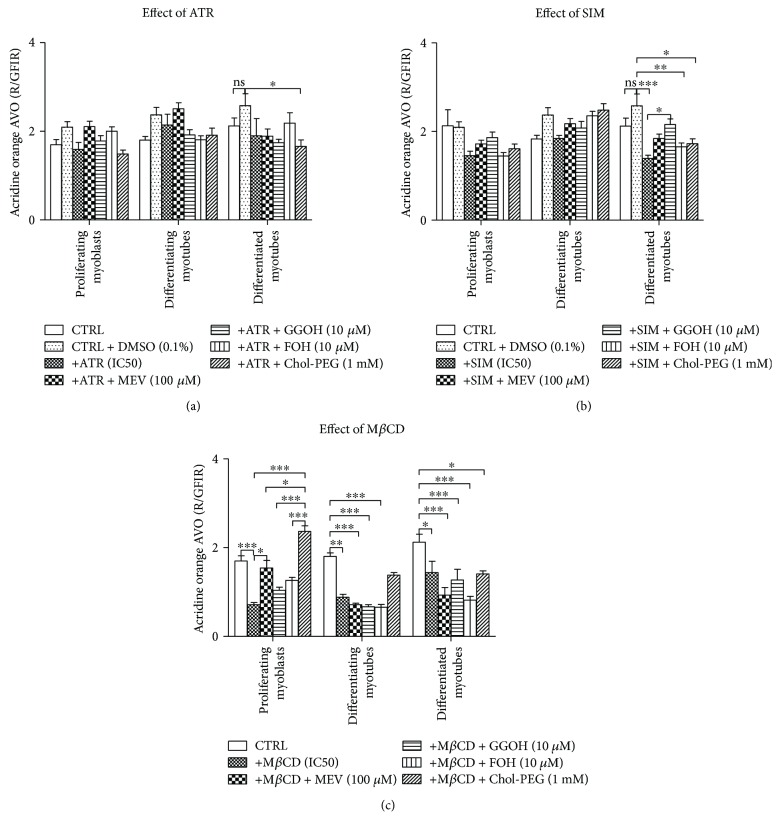
Figure 5.
Effect of nonsterol isoprenoids and soluble cholesterol treatments on acidic vacuolar organelles (AVO) as red to green fluorescence intensity ratio (R/GFIR) in C2C12 myoblasts affected by statins or MβCD. C2C12 myoblasts were exposed for 24, 72, or 120 h to statins or MβCD (IC50) (day 1—proliferating myoblasts, day 3—differentiating myotubes, and day 5—differentiated myotubes). ATR or SIM was administered in the listed concentration at each day of differentiation: ATR: day 1—76 μM, day 3—46 μM, and day 5—36 μM; SIM: day 1—87 μM, day 3—6 μM, and day 5–3 μM. MβCD was added to give the final concentration: day 1—2.7 mM, day 3—1.9 mM, and day 5—1.1 mM or vehicle control (0.1% DMSO or 2% HS DMEM) without or with selected mevalonate pathway intermediate (mevalonate 100 μM, geranylgeraniol 10 μM, farnesol 10 μM, Chol-PEG 1 mM, dolichol 1 μg/mL, and ubiquinol 10 μg/mL). Next, cells were subjected to vital staining with acridine orange (see Materials and Methods). Red to green fluorescence intensity ratio (R/GFIR) was calculated in at least 10 replicates for each treatment and nontreated controls. Two-way ANOVA test for R/GFIR followed by Bonferroni's multiple comparisons was employed to analyze the data. The results of [time (proliferating myoblasts, differentiating myotubes, differentiated myotubes)] amounted to F(2,191) = 3.774, p = 0.0247 for ATR; F(2,194) = 11.21, p < 0.0001 for SIM; and F(2,189) = 11.78, p < 0.0001 for MβCD. Treatment: ATR, ATR + MEV, ATR + GGOH, ATR + FOH, and ATR + Chol-PEG (F(6,191) = 5.084, p < 0.0001); SIM, SIM + MEV, SIM + GGOH, SIM + FOH, and SIM + Chol-PEG (F(6,194) = 6.814, p < 0.0001); MβCD, MβCD + MEV, MβCD + GGOH, MβCD + FOH, and MβCD + Chol-PEG (F(5,189) = 23.42, p < 0.0001). Interaction: F(12,191) = 1.450, p = 0.1464 for ATR; F(12,194) = 2.604, p = 0.0031 for SIM; F(10,189) = 5.532, p < 0.0001 for MβCD. Error bars = SEM and ∗p < 0.05, ∗∗p < 0.01, and ∗∗∗p < 0.001 for comparison between the means. Results are means of three independent experiments.

