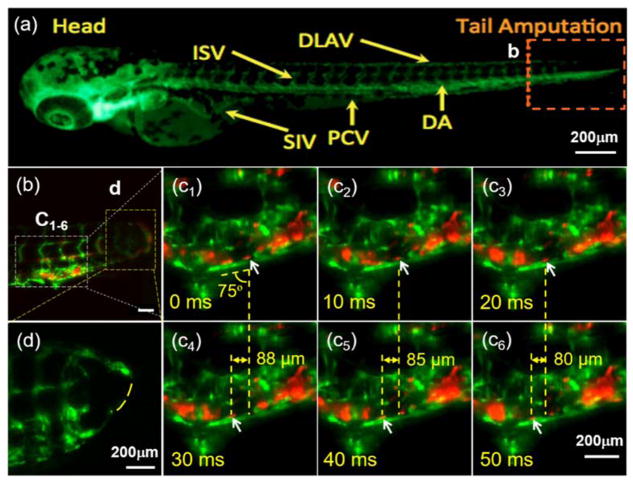
Figure 2.
Light-sheet microscopic illumination of vascular regeneration and circulating blood cells in response to tail amputation. (a) An inverted fluorescence image of a transgenic Tg(fli1:GFP;gata1:DsRed) zebrafish embryo showing the vasculature (green) at 3 dpf. ISV: intersegmental vessel; DLAV: dorsal longitudinal anastomotic vessel; SIV: subintestinal vessel; PCV: posterior cardinal vein; DA: dorsal aorta. Box b indicates the site of tail amputation. (b) LSFM captures blood cells (red) proximal to the site of amputation and regeneration. Dashed yellow boxes indicate locations of higher power images in the subsequent panels (c1–6). Arrows indicate the position of an individual RBC (red) in relation to the vascular endothelial layer (green) acquired by LSFM at 100 fps. The average angle between the vein (green PCV) and vertical axis of the frame is 75°, and the relative displacement along the horizontal axis of the frame in each 30 ms period is 88 μm (c4-c1), 85 μm (c5-c2) and 80 μm (c6-c3), respectively. These measures correspond to a net velocity of nearly 2.9 ± 0.1 μm/ms for that blood cell of interest. (d) The dashed line indicates the incomplete vascular regeneration between DLAV and DA in a separate zebrafish embryo treated with an inhibitor of ADAM10 (GI254023X, Sigma) which blocks Notch signaling. Scale bars: 200 μm.

