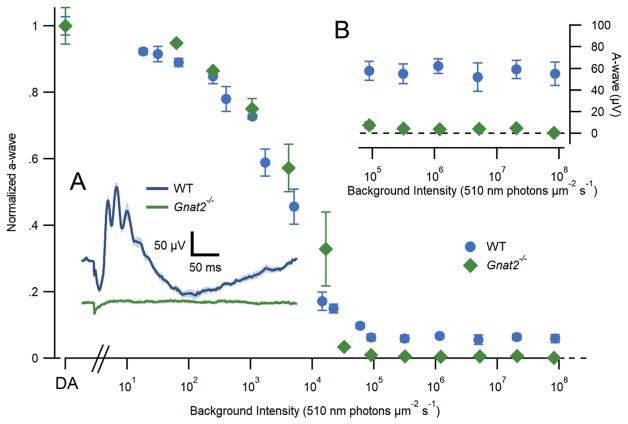
Fig. 5.
Cone-driven ERG responses are absent in Gnat2−/−mice. Electroretinogram a-wave amplitudes of WT (blue circles) and Gnat2−/− (green diamonds) mice in response to saturating flashes (365 nm; 1.22 × 10⁶ photons μm−2) delivered on increasingly intense 510 nm backgrounds. Insets: (A) Average electroretinogram of WT (blue) and Gnat2−/−(green) mice in response to a 1 ms saturating flash delivered on top of a rod-saturating background (510 nm; 1 × 10⁵ photons μm−2 s−1). The small deflection in the Gnat2−/−trace is an electrical artifact. (B) Expanded view of WT and Gnat2−/− a-wave amplitudes at the brightest background intensities. Error bars (frequently smaller than the points themselves) represent SEM.

