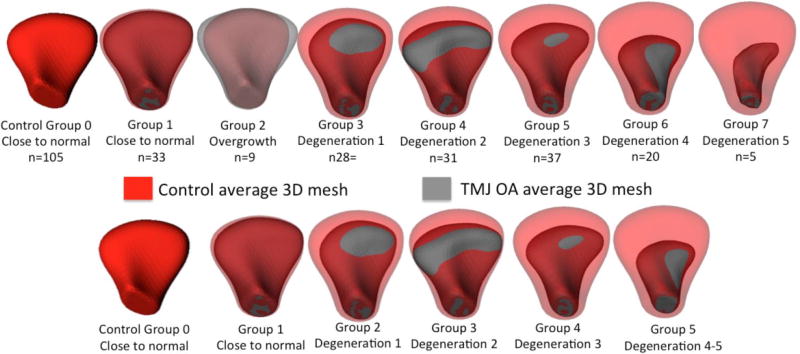
Figure 3.
Average 3D meshes for each group of morphology variability. Eight subgroups of condylar morphology variability are shown in the top row. For the neural network training data, the overgrowth group was not included and two subgroups with the most severe phenotypes of bone destruction were merged.

