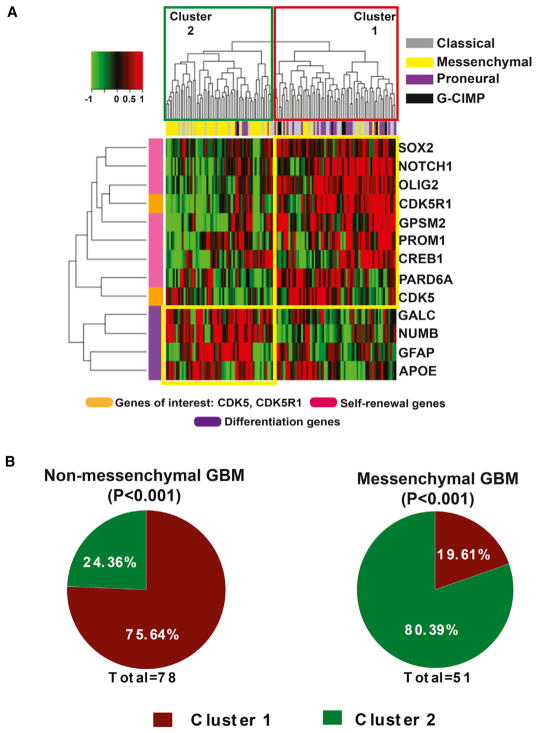
Figure 6. Expression Profile of CDK5 and Stem Cell Genes Segregate in Non-mesen-chymal GBMs.
(A) Using TCGA RNA-seq RSEM data, we examined whether the expression of CDK5, CDKR1, and CREB1, along with the self-renewal and asymmetric cell division marker genes, have a clinical significance. Unsupervised hierarchical clustering analysis indeed show that a majority of the non-mesenchymal GBMs (cluster 1) express high levels of these genes, whereas mesenchymal GBMs have high expression of differentiation markers (cluster 2).
(B) Our detailed analysis showed that 62.96% of non-mesenchymal tumors fall in cluster 1 (p < 0.001), whereas ~83.33% of mesenchymal tumors fall in cluster 2 (p < 0.001).

