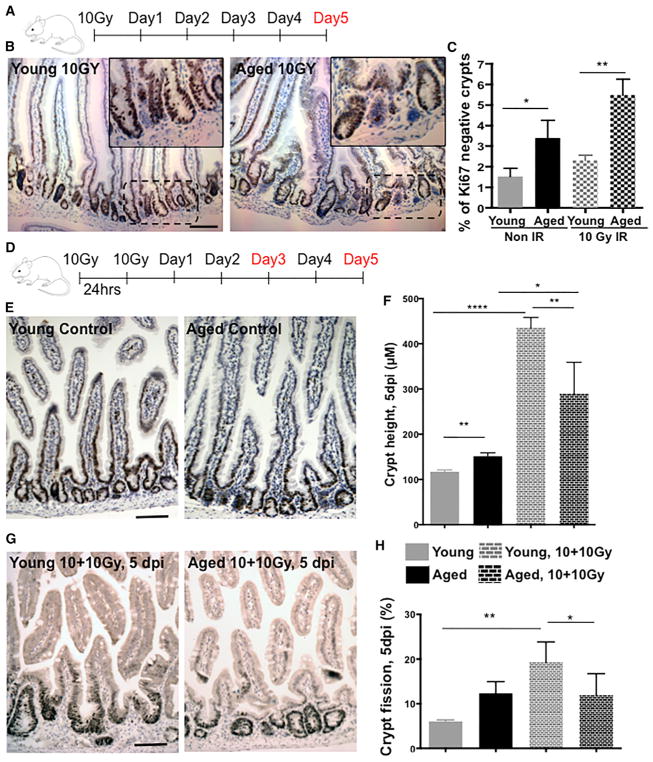
Figure 5. Impaired Regenerative Response in Aged Mouse Intestine.
(A) Experimental setup.
(B) Representative picture of Ki67 staining in young and aged crypts 5 days after 10-Gy radiation. Scale bar, 100 μm.
(C) Percentage of Ki67-negative crypts in young and aged mice.
(D) Experimental setup.
(E) Representative picture of Ki67 staining in young and aged crypts without radiation (control). Scale bar, 100 μm.
(F) Crypt depth in the proximal part of mouse small intestine 5 days after 10+10-Gy radiation.
(G) Representative picture of Ki67 staining in young and aged crypts 5 days after 10+10-Gy radiation. Scale bar, 100 μm.
(H) Percentage of crypt fission in young and aged crypts 5 days after 10+10-Gy radiation.
n = 8 mice/experimental group. *p < 0.05, **p < 0.01, ***p < 0.001. Error bars represent SD.

