
Figure 3.
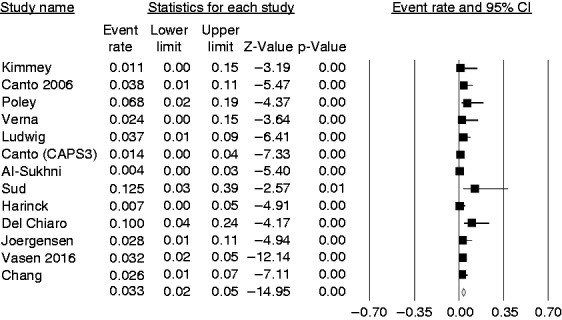
Forest plot showing the overall pooled prevalence of successful target lesions of the surveillance that is equal to 3.3% (95% confidence interval (CI) 2%–5%), with moderate heterogeneity (I2 = 40.5%).
Official websites use .gov
A
.gov website belongs to an official
government organization in the United States.
Secure .gov websites use HTTPS
A lock (
) or https:// means you've safely
connected to the .gov website. Share sensitive
information only on official, secure websites.
Forest plot showing the overall pooled prevalence of successful target lesions of the surveillance that is equal to 3.3% (95% confidence interval (CI) 2%–5%), with moderate heterogeneity (I2 = 40.5%).