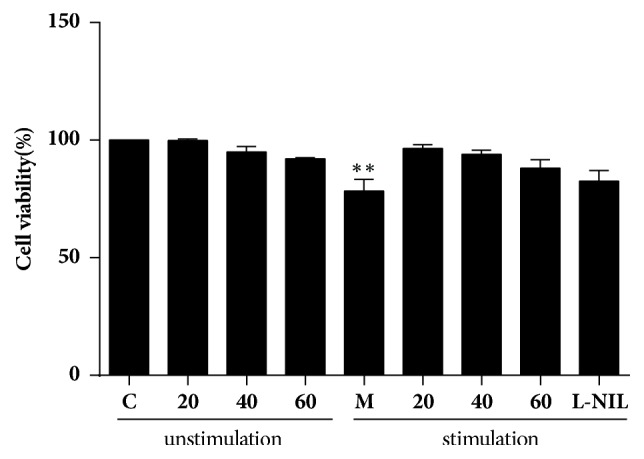
Figure 1.

Effect of TFRG on cell viability in LPS/IFNγ-stimulated and unstimulated RAW264.7 cells. RAW264.7 cells were treated with TFRG (20, 40, 60 μg/ml) for 24 h with or without LPS/IFNγ stimulation. Changes in survival are represented as percentages of the control group. C: control (nontreatment) group; M: LPS/IFNγ-stimulated model group; 20, 40, 60, L-NIL: treatment with TFRG (20, 40, 60 μg/ml) or L-NIL (50 μM) with/without LPS/IFNγ stimulation. Bars represent the mean ± SEM. Three independent experiments were performed. ∗∗P < 0.01 compared with the control group.
