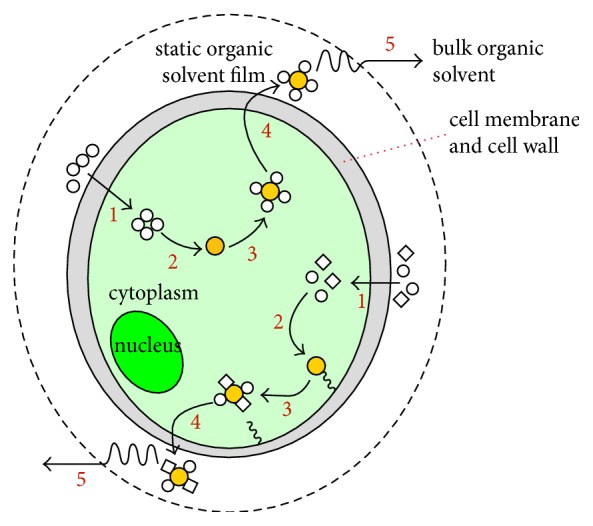
Figure 3.

Schematic diagram of the organic solvent-based microalgal lipid extraction mechanisms. The pathway shown at the top of the cell is for nonpolar organic solvent while the pathway shown at the bottom of the cell is for nonpolar/polar organic solvent mixture. Orange circle: lipids, white circle: nonpolar organic solvent, and white diamond: polar organic solvent [15].
