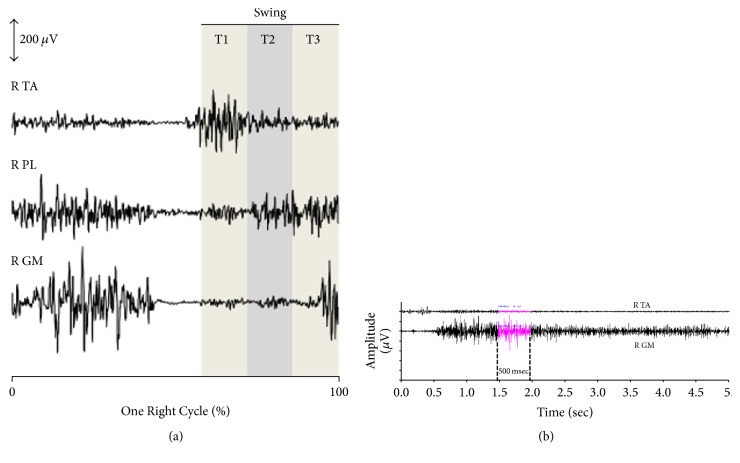
Figure 3.
Individual data from a child with right (R) hemiparesis. (a) Electromyography (amplitude in μV) of tibialis anterior (R TA), peroneus longus (R PL), and gastrocnemius medialis (R GM) during the swing phase. Subdivision of the swing phase in three equal parts T1, T2, and T3. (b) Calculation of the cocontraction index (CCI). Example of gastrocnemius medialis (R GM) CCI. The reference maximal agonist GM RMS is averaged over the 500 ms interval around the peak voltage during a submaximal voluntary effort selected, that is, standing on tiptoes (5 s): the EMG Easy Report© software (MerloBioEngineering, Italy) detected the peak (144 μV) and calculated the RMS (78 μV) around this peak, that is, between 1.41 s and 1.91 s (500 ms). The antagonist GM RMS is calculated during the swing phase (active ankle dorsi flexor; during swing phase the activation of ankle plantar flexor muscles (GM, PL) means an abnormal premature pattern of activation). The GM cocontraction index (CCIGM) is obtained from the ratio RMS GMantagonist/RMS GMagonist (during the whole swing phase and each subphase T1, T2, and T3).

