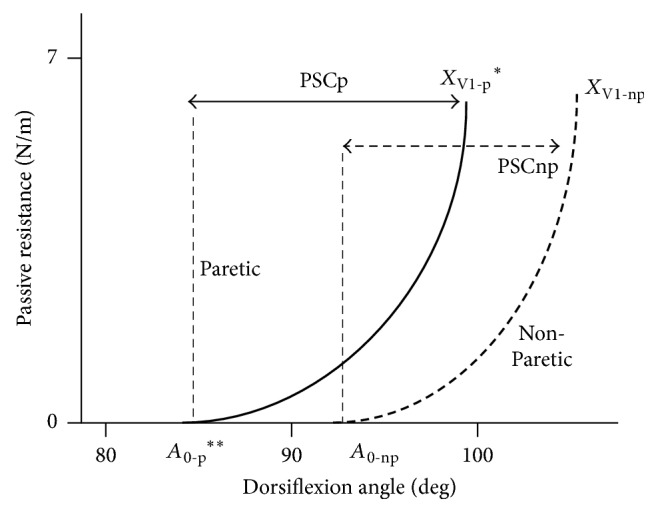
Figure 6.

Proposed model of gastrosoleus complex stiffness. There is shift towards plantar flexion on the paretic side. The curve is modelled as an exponential relation. x-axis (in degrees by goniometry); y-axis (in N/m by dynamometry); A0, tension threshold, that is, dorsiflexion angle at which very slow passive stretch of gastrosoleus complex faces abnormal resistance, detected by the palpation on the Achilles tendon; XV1, passive extensibility of gastrosoleus complex (V1, slowest stretch velocity possible); PSC, Passive Stretching Course = XV1 − A0; p: paretic, np: nonparetic; ∗p < 0.05; ∗∗p < 0.01.
