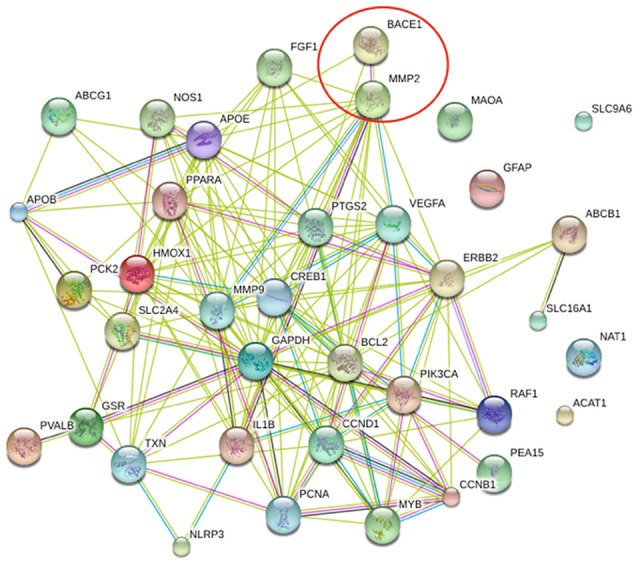
Figure 2.

PP1 map generated by STRING showing the interactions of the selected 20 proteins Edges represent protein-protein associations,  interactions from experimentally determined,
  text mining,
  known interactions from curated databases,
  gene fusions,
  gene co-occurrence,
  co-expression and
  protein homology.
