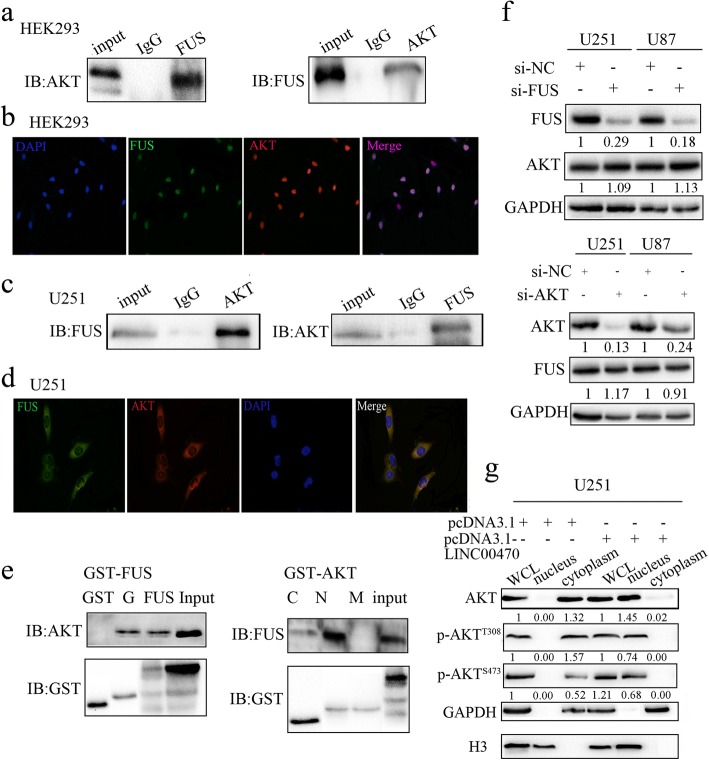
Fig. 4.
FUS bound to AKT and promoted AKT activation. a Co-IP analysis measured the exogenous interaction between FUS and AKT in HEK293 cells. b Representative immunofluorescence staining displayed the co-localization of FUS and AKT in the nucleus of HEK293 cells. c Co-IP analysis measured the endogenous interaction between FUS and AKT in U251 cells. d Representative immunofluorescence staining displayed the endogenous co-localization of FUS and AKT in the cytoplasm of U251 cells. e Left, GST pulldown assays showed that the GGR domain of FUS pulled down AKT; right, GST pulldown assays showed that the N-terminal region of AKT mainly pulled down FUS. f Upper, Western blotting measured the expression levels of FUS and AKT in GBM cells transfected by si-FUS; lower, Western blotting measured the expression levels of AKT and FUS in GBM cells transfected with si-AKT. g Western blotting measured the expression levels of AKT and pAKT in the whole lysis, cytoplasm, and nucleus of U251 cells transfected by pcDNA3.1-FUS

