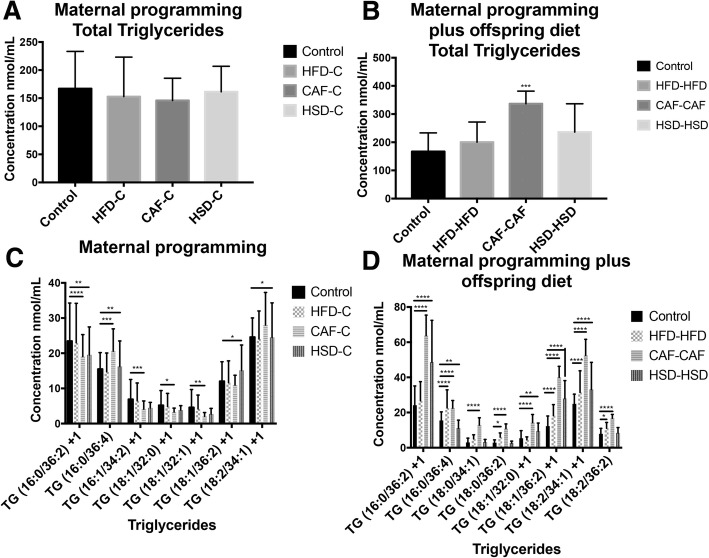
Fig. 4.
Lipidomic profile in plasma samples. Lipids were extracted from plasma samples following standard protocols and were analyzed as described in Methods. The concentration of each species was calculated using MultiQuant 3.0.1 software (AB SCIEX, Framingham, MA, USA) by relating the peak area of each species to that of the internal standard. Total plasma TG levels in maternal nutritional programming (a) and maternal and hypercaloric diet exposure after weaning (b). Selective plasma TG species in maternal nutritional programming (c) and maternal and hypercaloric diet exposure after weaning (d). Concentrations are expressed as the mean ± SEM with Chow and HFD, CAF or HSD. n = 10–12. *p < 0.05, **p < 0.01 and ***p < 0.001

