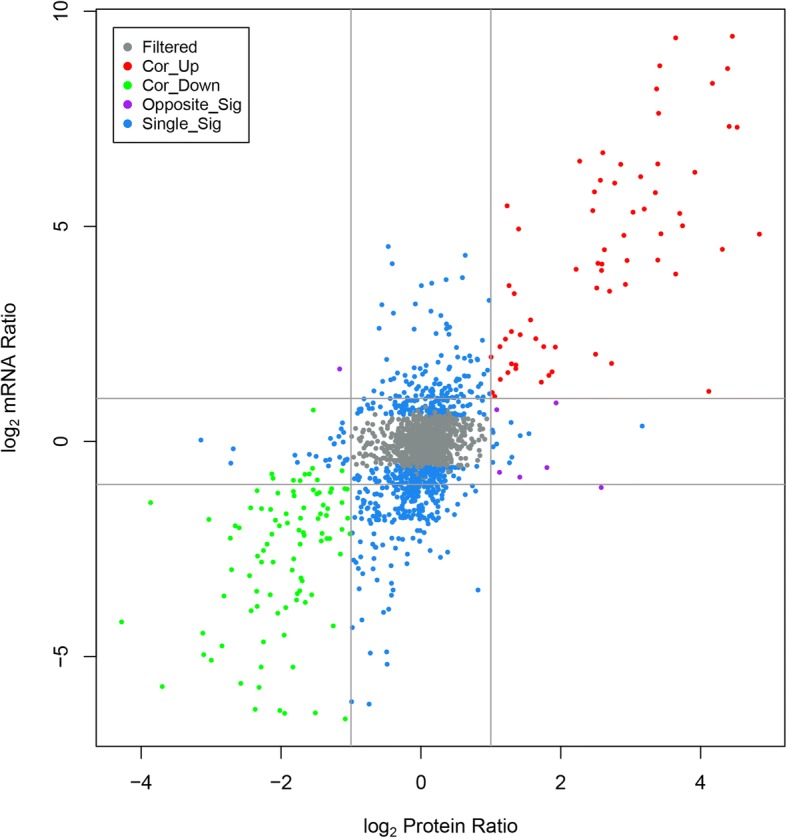
Fig. 2.

Relationship patterns of all of the quantitative mRNA and protein. In the nine-quadrant diagram, the abscissa is the protein expression and the ordinate is the gene expression. Each color denotes a log2 mRNA ratio and a log2 protein ratio. Gray (filtered) represents genes and proteins with no significant difference, red (Cor_up) indicates up-regulated genes and proteins, green (Cor_down) indicates down-regulated genes and proteins, purple (Opposite_Sig) indicates that DEGs and DEPs show opposite up- and down- regulation and blue (Single_Sig) indicates that one of the genes and proteins differ
